. 2004 Apr;78(7):3578-600.
doi: 10.1128/jvi.78.7.3578-3600.2004.

Differential tissue-specific regulation of antiviral CD8+ T-cell immune responses during chronic viral infection

Affiliations

Differential tissue-specific regulation of antiviral CD8+ T-cell immune responses during chronic viral infection

Shenghua Zhou et al. J Virol. 2004 Apr.

Abstract

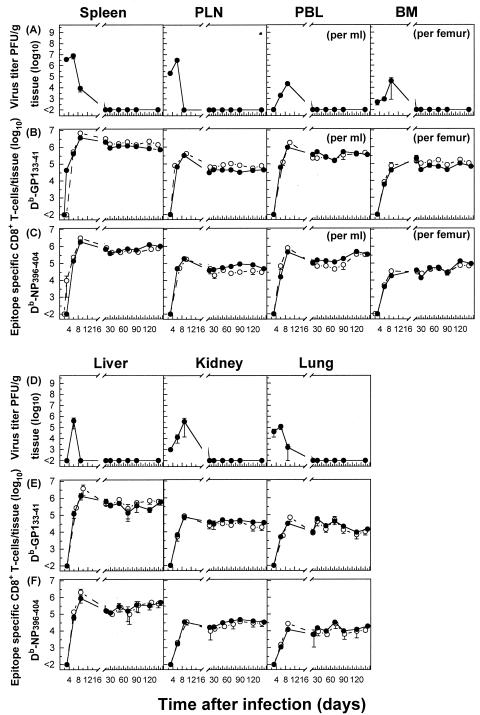
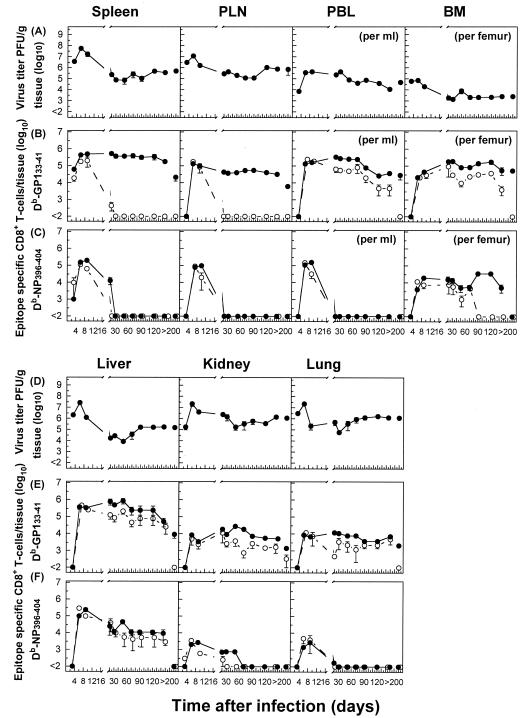
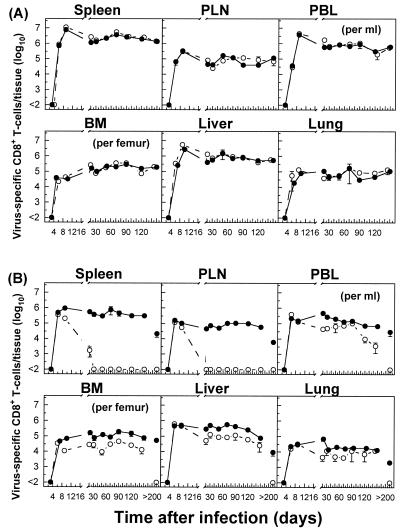
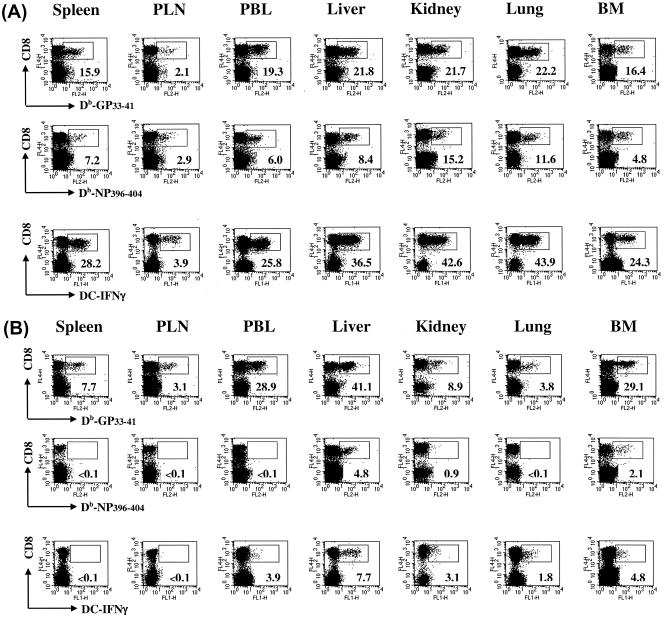
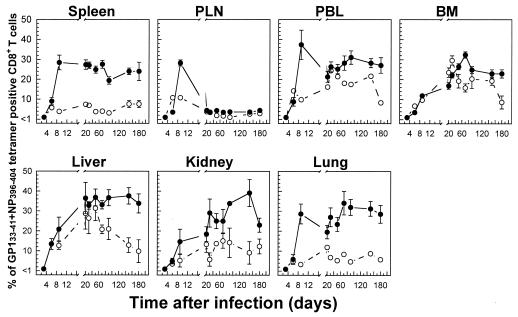
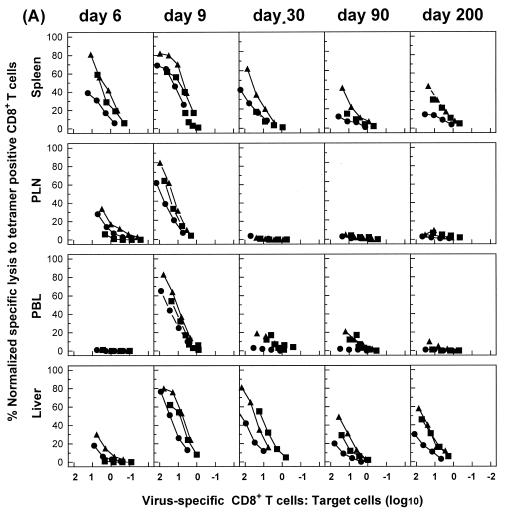
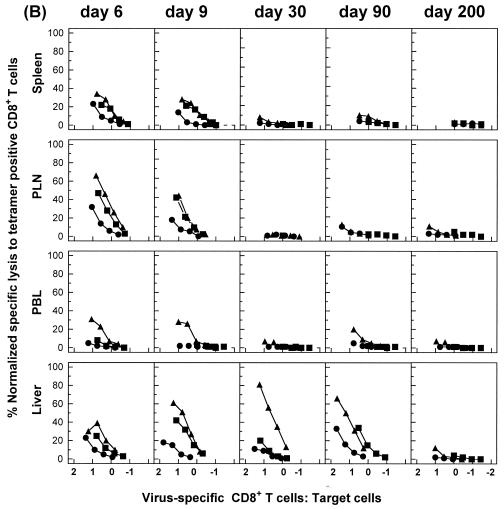
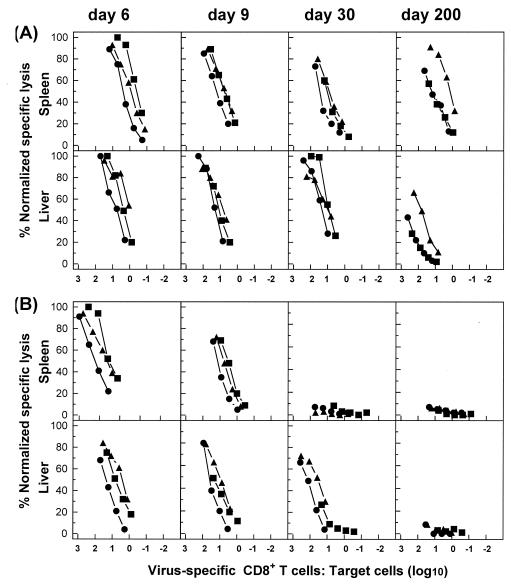
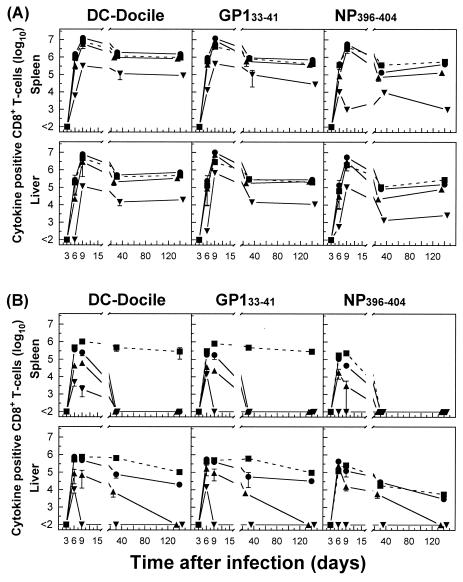
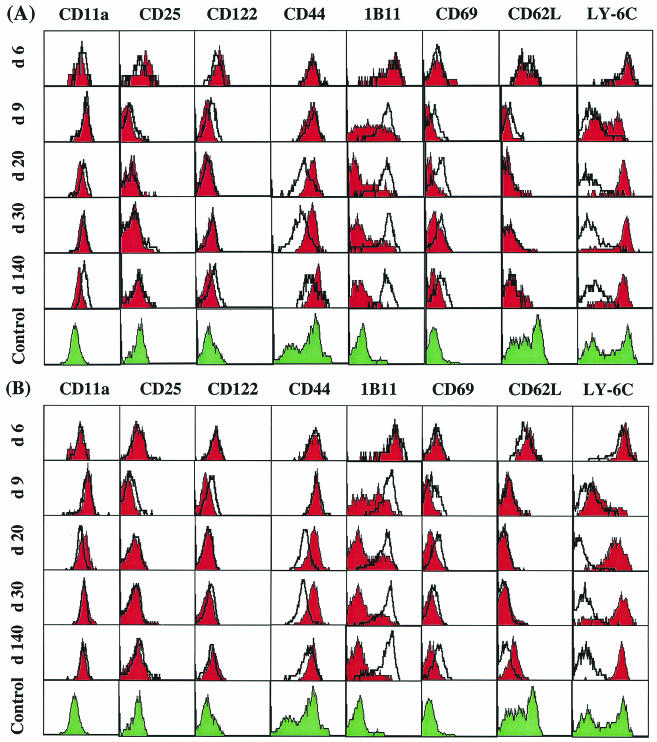
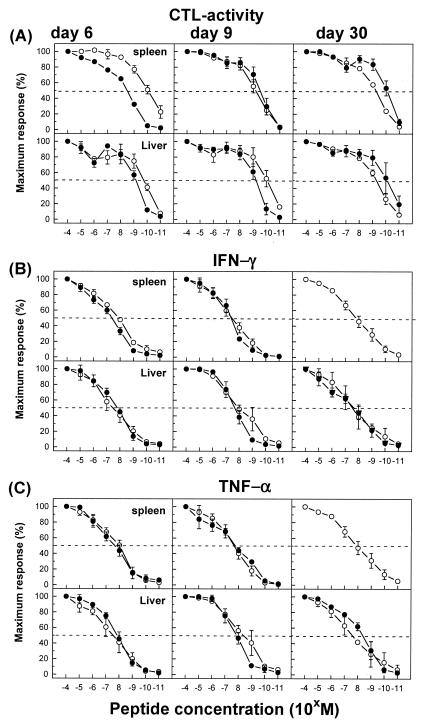
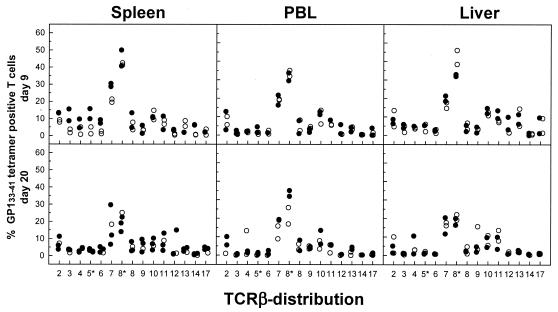
The hallmarks of the immune response to viral infections are the expansion of antigen-specific CD8(+) cytotoxic T lymphocytes (CTLs) after they encounter antigen-presenting cells in the lymphoid tissues and their subsequent redistribution to nonlymphoid tissues to deal with the pathogen. Control mechanisms exist within CTL activation pathways to prevent inappropriate CTL responses against disseminating infections with a broad distribution of pathogen in host tissues. This is demonstrated during overwhelming infection with the noncytolytic murine lymphocytic choriomeningitis virus, in which clonal exhaustion (anergy and/or deletion) of CTLs prevents immune-mediated pathology but allows persistence of the virus. The mechanism by which the immune system determines whether or not to mount a full response to such infections is unknown. Here we present data showing that the initial encounter of specific CTLs with infected cells in lymphoid tissues is critical for this decision. Whether the course of the viral infection is acute or persistent for life primarily depends on the degree and kinetics of CTL exhaustion in infected lymphoid tissues. Virus-driven CTL expansion in lymphoid tissues resulted in the migration of large quantities of CTLs to nonlymphoid tissues, where they persisted at stable levels. Surprisingly, although virus-specific CTLs were rapidly clonally exhausted in lymphoid tissues under conditions of chronic infection, a substantial number of them migrated to nonlymphoid tissues, where they retained an effector phenotype for a long time. However, these cells were unable to control the infection and progressively lost their antiviral capacities (cytotoxicity and cytokine secretion) in a hierarchical manner before their eventual physical elimination. These results illustrate the differential tissue-specific regulation of antiviral T-cell responses during chronic infections and may help us to understand the dynamic relationship between antigen and T-cell populations in many persistent infections in humans.


Figures

FIG. 1.
FIG. 1.
Persistence of virus-specific CD8+ T cells at high stable memory levels in nonlymphoid tissues during an acute viral infection. Analyses were performed to correlate the kinetics of virus replication (A and D) with the kinetics of virus-specific CD8+ T-cell responses (B, C, E, and F). C57BL/6 mice were infected with 102 PFU of LCMV-Docile, and virus titers in different tissues were measured at the indicated times. Data shown are means ± standard errors of the means (SEM) of log10 PFU/g of tissue for 5 to 10 mice. Parallel total numbers of GP133-41 or NP396-404 peptide-specific CD8+ T cells were determined by staining with H-2Db tetramers (•) or measuring intracellular IFN-γ (○) production after the stimulation of cells with the appropriate peptide. Values were derived by multiplying the percentages of total tetramer-positive cells by the total numbers of lymphocytes isolated from a given tissue. Data shown are means ± SEM of log10 virus-specific T cells per spleen for 5 to 10 mice.
FIG. 2.
FIG. 2.
Differential regulation of virus-specific CD8+ T-cell responses in lymphoid versus nonlymphoid tissues during a persistent infection. C57BL/6 mice were infected with 2 × 10⁶ PFU of LCMV-Docile, and virus titers in different tissues were measured at the indicated times (A and D). Data shown are means ± SEM of log10 PFU/g of tissue for 3 to 5 mice. Total numbers of GP133-41 or NP396-404 peptide-specific CD8+ T cells were determined by staining with H-2Db tetramers (•) or measuring intracellular IFN-γ (○) production after the stimulation of cells with the appropriate peptide (B, C, E, and F). Data shown are means ± SEM of log10 virus-specific T cells per spleen for 5 to 10 mice.
FIG. 3.
FIG. 3.
Kinetics of total virus-specific CD8+ T-cell response in different tissues based on tetramer versus intracellular IFN-γ secretion after stimulation of lymphocytes with DC2.4 virus-infected cells during acute or persistent infections. C57BL/6 mice were infected with 102 (A) or 2 × 10⁶ (B) PFU of LCMV-Docile, and total numbers of virus-specific CD8+ T cells (sum of GP133-41 and NP396-404 peptide-specific T cells) were determined by staining with Db/GP133-41 and Db/NP396-404 tetramers (•). The total numbers of virus-specific CD8+ T cells from tissues were tested for the ability to produce IFN-γ after short-term culturing with virus-infected DC2.4 cells on the indicated days after infection (○). Data shown are means ± SEM of log10 virus-specific T cells per tissue for 3 to 6 mice.
FIG. 4.
FIG. 4.
Expansion and distribution of epitope-specific CD8+ T cells in lymphoid and nonlymphoid tissues in relation to the total numbers of virus-specific IFN-γ-producing CD8+ T cells during acute versus persistent infections. C57BL/6 mice were infected with 102 (A) or 2 × 10⁶ (B) PFU of LCMV-Docile, and lymphocytes were isolated from the indicated tissues 20 days after infection. The percentage of antigen-specific CD8+ T cells was assessed by staining with Db/GP133-41 (top panels) or Db/NP396-404 (middle panels) tetramers and antibody against CD8α. Plots shown are gated on live cells. Total numbers of virus-specific CD8+ T cells producing IFN-γ after stimulation with virus-infected DC2.4 cells were determined by concurrent analyses (bottom panels). The percentages of CD8+ T cells staining positive for Db/GP133-41 or Db/NP396-404 tetramers or producing IFN-γ are indicated in the lower right corners of the corresponding panels. Results are representative of several separate experiments.
FIG. 5.
FIG. 5.
Tissue-specific kinetics of the virus-specific CD8+ T-cell response based on percentages of CD8+ T cells that were tetramer positive during acute versus persistent infections. The percentages of total CD8+ T cells specific for GP133-41 or NP396-404 in the indicated tissues, as determined by tetramer staining, were calculated based on the data presented in Fig. 1 for acute infections (•) or in Fig. 2 for persistent infections (○) of C57BL/6 mice with LCMV-Docile. Data shown are means ± SEM of log10 virus-specific T cells per tissue for 5 to 10 mice.
FIG. 6.
FIG. 6.
Virus-specific CD8+ T cells from nonlymphoid tissues preserve their ex vivo lytic activity for prolonged periods during persistent infections. C57BL/6 mice were infected with 102 (A) or 2 × 10⁶ (B) PFU of LCMV-Docile, and lymphocytes were isolated from tissues at the indicated times. Direct ex vivo CTL activity was measured on virus-infected MC57G cells (•) or on EL-4 cells loaded with a peptide GP133-41 (▴) or NP396-404 (▪) target at an E:T ratio of 200:1 for all tissues. The E:T cell values shown are corrected for the number of GP133-41 and NP396-404 tetramer-positive cells in the total virus-specific CTL population (virus-infected targets) or for the number of GP133-41 or NP396-404 tetramer-positive cells in each epitope-specific CTL population (peptide-loaded targets). Lysis of untreated target cells was usually ≤5% at the highest E:T ratio. However, in a few cases, nonspecific lysis exceeding the 5% level was subtracted from corresponding lysis values. Results are representative of three separate experiments.
FIG. 6.
FIG. 6.
Virus-specific CD8+ T cells from nonlymphoid tissues preserve their ex vivo lytic activity for prolonged periods during persistent infections. C57BL/6 mice were infected with 102 (A) or 2 × 10⁶ (B) PFU of LCMV-Docile, and lymphocytes were isolated from tissues at the indicated times. Direct ex vivo CTL activity was measured on virus-infected MC57G cells (•) or on EL-4 cells loaded with a peptide GP133-41 (▴) or NP396-404 (▪) target at an E:T ratio of 200:1 for all tissues. The E:T cell values shown are corrected for the number of GP133-41 and NP396-404 tetramer-positive cells in the total virus-specific CTL population (virus-infected targets) or for the number of GP133-41 or NP396-404 tetramer-positive cells in each epitope-specific CTL population (peptide-loaded targets). Lysis of untreated target cells was usually ≤5% at the highest E:T ratio. However, in a few cases, nonspecific lysis exceeding the 5% level was subtracted from corresponding lysis values. Results are representative of three separate experiments.
FIG. 7.
FIG. 7.
Virus-specific CD8+ T cells in nonlymphoid tissues during chronic infection preserve the ability to up-regulate lytic activity after antigenic stimulation in vitro. C57BL/6 mice were infected with 102 (A) or 2 × 10⁶ (B) PFU of LCMV-Docile, and lymphocytes isolated from the spleen and liver at the indicated times after infection were stimulated with virus-infected macrophages as described in Materials and Methods. The cytolytic activity of restimulated lymphocytes cultured at a density of 4 × 10⁶/well was measured in a 51Cr release assay using virus-infected MC57G cells (•) or EL-4 cells loaded with peptide GP133-41 (▴) or NP396-404 (▪) as a target. Cultured cells were resuspended in 1 ml of medium per culture well, and serial threefold dilutions of effector cells were performed. E:T cell ratios shown in the blot are corrected for the total number of tetramer-positive cells per culture well of the original lymphocyte populations (prior to culture), as described in Materials and Methods. Results are representative of three separate experiments.
FIG. 8.
FIG. 8.
Virus-specific CD8+ T cells in nonlymphoid tissues experience functional exhaustion with a hierarchical loss of IL-2, TNF-α, and IFN-γ during chronic infections. C57BL/6 mice were infected with 102 (A) or with 2 × 10⁶ (B) PFU of LCMV-Docile, and lymphocytes were isolated from the spleen and liver at the indicated times. The total numbers of virus- or GP133-41 or NP396-404 epitope-specific CD8+ T cells producing IFN-γ (•), TNF-α (▴), or IL-2 (▾) after short-term culturing with virus-infected DC2.4 cells or peptide, respectively, are shown. For a comparison, the numbers of total (sum of GP133-41 and NP396-404) (left panels), GP133-41 (middle panels), or NP396-404 (right panels) peptide-specific CD8+ T cells were determined by staining with H-2Db tetramers (▪). Data shown are means ± SEM of log10 virus-specific T cells per tissue for 5 to 10 mice.
FIG. 9.
FIG. 9.
Phenotypic analysis of virus-specific CD8+ T cells from the spleen and liver during acute versus persistent infections. Lymphocytes isolated from the spleens (A) or livers (B) of C57BL/6 mice infected with 102 PFU (red histograms) or 2 × 10⁶ PFU (open, thickly lined histograms) of LCMV-Docile at the indicated times after infection were triple stained with anti-CD8α, an antibody specific for CD11a (LFA-1), CD25 (IL-2-Rα), CD122 (IL-2-Rβ), CD44, 1B11 (CD43), CD69, CD62L, or Ly-6C, and the Db/GP133-41 tetramer. As a control, cells from uninfected mice were double stained for CD8α and the activation markers listed above (green histograms). Histograms are gated on cells that were positive for CD8α and Db/GP133-41 tetramer. These results are representative of three separate experiments.
FIG. 10.
FIG. 10.
Functional avidity of virus-specific CD8+ T cells in the spleens and livers of mice with acute versus persistent infections. C57BL/6 mice were infected with 102 (○) or 2 × 10⁶ (•) PFU of LCMV-Docile, and lymphocytes were isolated from the spleen and liver at the indicated times. Function-based avidities of GP133-41-specific CD8+ T cells were determined by quantifying the amount of peptide required to induce ex vivo lytic activity against EL-4 target cells loaded with the indicated concentrations of GP133-41 (KAVYNFATM) peptide (A). Antigen-specific lysis of target cells at each peptide concentration is shown as a percentage of the maximum response obtained with a 10−4 M peptide concentration. In parallel analyses, IFN-γ (B) or TNF-α (C) production was measured after direct ex vivo stimulation with graded doses of peptide. The results were expressed as percentages of the maximum response attained with a saturating peptide concentration (10−4 M). Data shown are means ± SEM of log10 virus-specific T cells per tissue for three experiments.
FIG. 11.
FIG. 11.
Distribution profiles of Vβ usage by GP133-41-specific CD8+ T cells isolated from the spleen and liver during acute versus chronic infections. C57BL/6 mice were infected with 102 (○) or 2 × 10⁶ (•) PFU of LCMV-Docile, and lymphocytes isolated from the spleen, blood, and liver at the indicated times were triple stained with an anti-CD8α antibody, the Db/GP133-41 tetramer, and an antibody specific for Vβ segments. Results from individual mice are shown as percentages of the GP133-41-specific CD8+ T-cell populations for each Vβ segment.
FIG. 12.
FIG. 12.
Immune system-mediated liver injury during chronic infection of mice with LCMV. (A) C57BL/6 mice were infected with 2 × 10⁶ PFU of LCMV-Docile, and liver tissues recovered on days 9 (b), 15 (c), 21 (d), 28 (e), and 35 (f) after infection were fixed in acetone, sectioned, and stained with hematoxylin and eosin. Liver tissues from uninfected mice (a) were used as a control. Arrows indicate periportal mononuclear infiltrates in tissues of infected mice. Original magnification, ×200. (B) Liver-specific enzyme activities in serum (sALT and sAST) were measured over a period of 35 days after the infection of mice with 2 × 10⁶ PFU of LCMV-Docile (•). Control values from sera of uninfected mice are also shown (○). Data shown are means ± SEM of enzymatic activities (units per liter) of three individual mice.
FIG. 12.
FIG. 12.
Immune system-mediated liver injury during chronic infection of mice with LCMV. (A) C57BL/6 mice were infected with 2 × 10⁶ PFU of LCMV-Docile, and liver tissues recovered on days 9 (b), 15 (c), 21 (d), 28 (e), and 35 (f) after infection were fixed in acetone, sectioned, and stained with hematoxylin and eosin. Liver tissues from uninfected mice (a) were used as a control. Arrows indicate periportal mononuclear infiltrates in tissues of infected mice. Original magnification, ×200. (B) Liver-specific enzyme activities in serum (sALT and sAST) were measured over a period of 35 days after the infection of mice with 2 × 10⁶ PFU of LCMV-Docile (•). Control values from sera of uninfected mice are also shown (○). Data shown are means ± SEM of enzymatic activities (units per liter) of three individual mice.
FIG. 13.
FIG. 13.
Rapid functional loss and physical elimination of virus-specific CD8+ T cells in lymphoid versus nonlymphoid tissues in the absence of CD4+ T-cell help during chronic LCMV infection. C57BL/6-CD4−/− mice were infected with 2 × 10⁶ PFU of LCMV-Docile, and virus titers in different tissues were measured at the indicated times (A and D). Data shown are means ± SEM of log10 PFU/g of tissue for 3 to 5 mice. Total numbers of GP133-41 or NP396-404 peptide-specific CD8+ T cells were determined by staining with H-2Db tetramers (•) or measuring intracellular IFN-γ (○) production after stimulation of cells with the appropriate peptide (B, C, E, and F). Data shown are means ± SEM of log10 virus-specific T cells per spleen for 5 to 10 mice.
FIG. 14.
FIG. 14.
Capacity of virus-specific CD8+ T cells and of CD4+ T cells to control virus levels in different tissues of mice with persistent LCMV infections. Kinetics of viral titers in different tissues of C57BL/6 mice infected with 2 × 10⁶ PFU of LCMV-Docile and depleted of CD8+ T cells (○) or CD4+ T cells (▴) by an antibody treatment on day 15 after infection (indicated by arrow) are shown. Infected but untreated C57BL/6 mice were used as a control (•). Data shown are means ± SEM of log10 virus-specific T cells per spleen for 3 to 5 mice.

Similar articles

Cited by

References

    1. Ahmed, R., L. A. Morrison, and D. M. Knipe. 1996. Persistence of viruses, p. 219-249. In B. N. Fields, D. M. Knipe, and P. M. Howley (ed.), Fields virology, third ed., vol. 1. Lippincott Williams & Wilkins, Philadelphia, Pa.
    1. Altman, J. D., P. A. H. Moss, P. J. R. Goulder, D. H. Barouch, M. G. McHeyzer-Williams, J. I. Bell, A. J. McMichael, and M. M. Davis. 1996. Phenotypic analysis of antigen-specific T lymphocytes. Science 274:94-96. - PubMed
    1. Appay, V., D. F. Nixon, S. M. Donahoe, G. M. A. Gillesie, T. Dong, A. King, G. S. Ogg, M. L. Spiegel, C. Conlon, C. A. Spina, et al. 2000. HIV-specific CD8+ T cells produce antiviral cytokines but are impaired in cytolytic function. J. Exp. Med. 192:63-75. - PMC - PubMed
    1. Badovinac, V. P., G. A. Corbin, and J. T. Harty. 2000. Off cycling of TNF production by antigen-specific CD8+ T cells is antigen independent. J. Immunol. 165:5387-5391. - PubMed
    1. Battegay, M., S. Cooper, A. Althage, H. Hengartner, and R. M. Zinkernagel. 1991. Quantification of lymphocytic choriomeningitis virus with an immunological focus assay in 24 and 96 well plates. J. Virol. Methods 33:191-198. - PubMed

Publication types

MeSH terms

Substances