. 2004 Mar 23;101(12):4164-9.
doi: 10.1073/pnas.0308531101. Epub 2004 Mar 11.

Metagenes and molecular pattern discovery using matrix factorization

Affiliations

Metagenes and molecular pattern discovery using matrix factorization

Jean-Philippe Brunet et al. Proc Natl Acad Sci U S A. .

Abstract

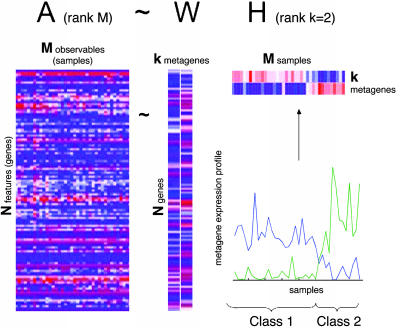
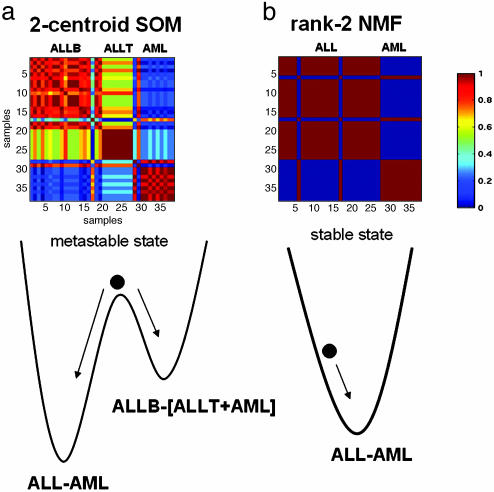
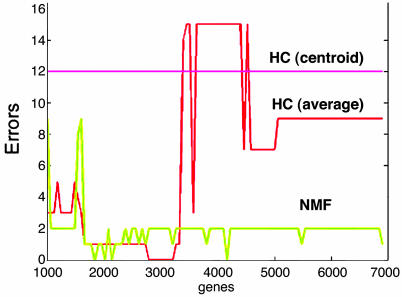
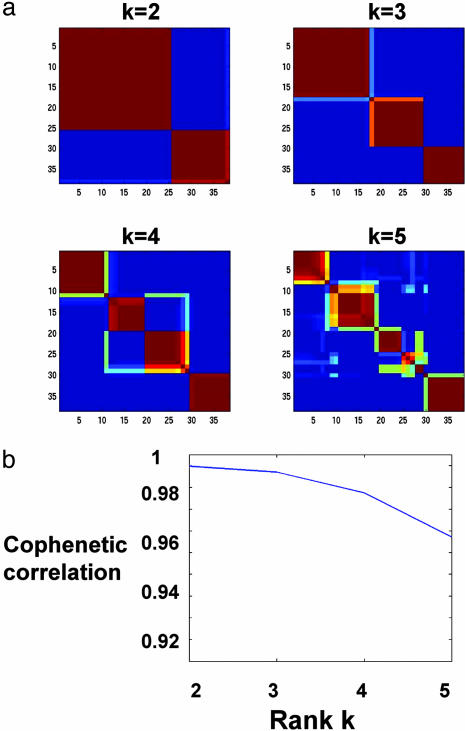
We describe here the use of nonnegative matrix factorization (NMF), an algorithm based on decomposition by parts that can reduce the dimension of expression data from thousands of genes to a handful of metagenes. Coupled with a model selection mechanism, adapted to work for any stochastic clustering algorithm, NMF is an efficient method for identification of distinct molecular patterns and provides a powerful method for class discovery. We demonstrate the ability of NMF to recover meaningful biological information from cancer-related microarray data. NMF appears to have advantages over other methods such as hierarchical clustering or self-organizing maps. We found it less sensitive to a priori selection of genes or initial conditions and able to detect alternative or context-dependent patterns of gene expression in complex biological systems. This ability, similar to semantic polysemy in text, provides a general method for robust molecular pattern discovery.


Figures

Fig. 1.
Fig. 1.
A rank-2 reduction of a DNA microarray of N genes and M samples is obtained by NMF, AWH. For better visibility, H and W are shown with exaggerated width compared with original data in A, and a white line separates the two columns of W. Metagene expression levels (rows of H) are color coded by using a heat color map, from dark blue (minimum) to dark red (maximum). The same data are shown as continuous profiles below. The relative amplitudes of the two metagenes determine two classes of samples, class 1 and class 2. Here, samples have been ordered to better expose the class distinction.
Fig. 3.
Fig. 3.
Consensus clustering matrices without reordering for data from leukemia samples averaged over 50 connectivity matrices using 5,000 of the most highly varying genes according to their coefficient of variation. (a) Consensus matrix for a two-centroid SOM shows superposition of two clustering solutions, ALL-AML and ALLB-[ALLT+AML]. A relative probability of about two-thirds is estimated by looking at the color-coded consensus: yellow (≈70%) for the first pattern and light blue (≈30%) for the second. Metastability of the two-centroid SOM with respect to random initial conditions is illustrated by the motion of a rolling ball on a double-well potential. (b) Consensus matrix for a rank-2 NMF. The 0–1 pattern indicates highly robust classification. NMF stable attractor leads to ALL-AML partition irrespective of random initial condition. The lack of reordering ordering highlights the two ALL samples that consistently cluster with the AMLs (discussed in more detail in ref. 5).
Fig. 2.
Fig. 2.
Number of ALL or AML samples improperly clustered by agglomerative HC and NMF as a function of the number of features (genes). One hundred clustering computations were performed at intervals equally spaced between 1,000 and 6,913 of the most highly varying genes. Results are shown as continuous lines for clarity. HC, agglomerative HC using Pearson correlation and two different linkage methods [average and average-group (or centroid)]. NMF, a rank-2 factorization is performed with a fixed random initial condition.
Fig. 4.
Fig. 4.
(a) Reordered consensus matrices averaging 50 connectivity matrices computed at k = 2–5 for the leukemia data set with the 5,000 most highly varying genes according to their coefficient of variation. Samples are hierarchically clustered by using distances derived from consensus clustering matrix entries, colored from 0 (deep blue, samples are never in the same cluster) to 1 (dark red, samples are always in the same cluster). Compositions of the leukemia clusters determined by HC of consensus matrices are as follows: for k = 2: {(25 ALL), (11 AML and 2 ALL)}, k = 3: {(17 ALL-B), (8 ALL-T and 1 ALL-B), (11 AML and 1 ALL-B)}, k = 4: {(11 ALL-B), (7 ALL-B and 1 AML), (8 ALL-T and 1 ALL-B), (10 AML)}. (b) Cophenetic correlation coefficients for hierarchically clustered matrices in a.
Fig. 5.
Fig. 5.
Illustration of model selection with NMF on the medulloblastoma data set. HC used dchip's analyzer (www.biostat.harvard.edu/complab/dchip) and centroid linkage. The NMF class assignments for k = 2, 3, and 5 are shown color-coded. At k = 5, seven of nine desmoplastic samples (highlighted in red on dendrogram) fall into the same NMF class. More detailed sample class assignments are given in supporting information.
Fig. 6.
Fig. 6.
(a) NMF model selection for a data set of 25 classic and 9 desmoplastic medulloblastoma tumors [n = 5,893; M = 34 (14)]. At each rank k, a consensus matrix, averaging 50 connectivity matrices, is reordered by using HC (color map as Fig. 4). In addition to a robust two-class partition (not shown), the consensus is strong for k = 3, 5, indicating reproducible partitioning of samples into two, three, and five classes but not four or six. (b) Cophenetic correlation coefficients corresponding to the HC of consensus matrices for k = 2–7 shows a dip at k = 4, where reproducibility is poor, and suggests k = 5as the largest number of classes recognized by NMF for this data set.
Fig. 7.
Fig. 7.
Analysis of central nervous system embryonal tumors using 5,560 genes. The data set consists of 34 samples, including 10 classic medulloblastomas, 10 malignant gliomas, 10 rhabdoids, and 4 normals. (a) The dendrogram from HC indicates two or three major subclasses but gives no clear indication of a four-class split. (b) Reordered consensus matrices for k = 2–5 centroid SOM clusterings from 20 initial conditions. Cophenetic correlation argues for a three-class decomposition. (c) Reordered consensus matrices for 20 NMF initial conditions (50 NMF iterations each), for k = 2–5 (color scale same as Fig. 2). Cophenetic correlation coefficient suggests the existence of at most four robust classes.

Similar articles

Cited by

References

    1. Eisen, M., Spellman, P., Brown, P. & Botstein, D. (1998) Proc. Natl. Acad. Sci. USA 95, 14863–14868. - PMC - PubMed
    1. Alizadeh, A. A., Eisen, M. B., Davis, R. E., Ma, C., Lossos, I. S., Rosenwald, A., Boldrick, J. C., Sabet, H., Tran, T., Yu, X., et al. (2000) Nature 403, 503–511. - PubMed
    1. Perou, C. M., Sorlie, T., Eisen, M. B., van de Rijn, M., Jeffrey, S. S., Rees, C. A., Pollack, J. R., Ross, D. T., Johnsen, H., Akslen, L. A., et al. (2000) Nature 406, 747–752. - PubMed
    1. Tamayo, P., Slonim, D., Mesirov, J., Zhu, Q., Dmitrovsky, E., Lander, E. S. & Golub, T. R. (1999) Proc. Natl. Acad. Sci. USA 96, 2907–2912. - PMC - PubMed
    1. Golub, T. R., Slonim, D. K., Tamayo, P., Huard, C., Gaasenbeek, M., Mesirov, J. P., Coller, H., Loh, M. L., Downing, J. R., Caligiuri, M. A., et al. (1999) Science 286, 531–537. - PubMed

Publication types

MeSH terms