

Pressure-dissociable reversible assembly of intrinsically denatured lysozyme is a precursor for amyloid fibrils
- PMID: 15016916
- PMCID: PMC394761
- DOI: 10.1073/pnas.0305798101
Pressure-dissociable reversible assembly of intrinsically denatured lysozyme is a precursor for amyloid fibrils
Abstract
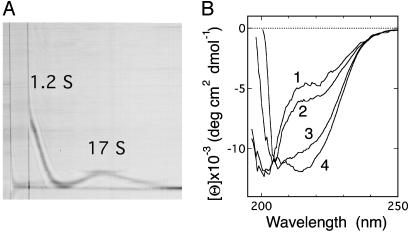
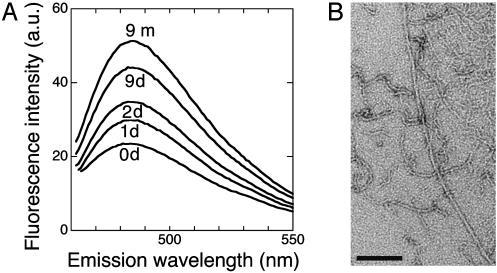
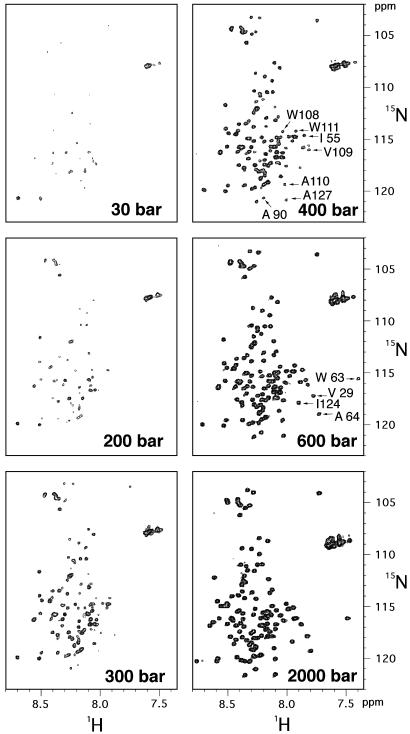
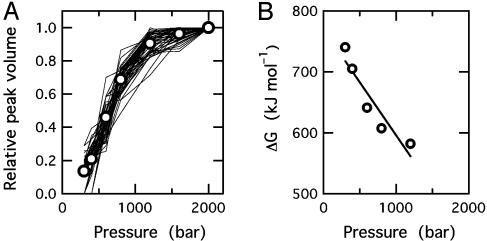
Although a diversity of proteins is known to form amyloid fibers, their common mechanisms are not clear. Here, we show that an intrinsically unfolded protein (U), represented by a disulfide-deficient variant of hen lysozyme with no tertiary structure, forms an amyloid-like fibril after prolonged incubation. Using variable pressure NMR along with sedimentation velocity, circular dichroism, and fluorescence measurements, we show that, before the fibril formation, the protein forms a pressure-dissociable, soluble assemblage (U'(n)) with a sedimentation coefficient of 17 S and a rich intermolecular beta-sheet structure. The reversible assemblage is characterized with a Gibbs energy for association of -23.3 +/- 0.8 kJ.mol(-1) and a volume increase of 52.7 +/- 11.3 ml.mol(-1) per monomer unit, and involves preferential interaction of hydrophobic residues in the initial association step. These results indicate that amyloid fibril formation can proceed from an intrinsically denatured protein and suggest a scheme N <==>U <==>U'(n)-->fibril as a common mechanism of fibril formation in amyloidogenic proteins, where two-way arrows represent reversible processes, one-way arrow represents an irreversible process, and N, U, and U'(n)represent, respectively, the native conformer, the unfolded monomeric conformer, and the soluble assemblage of unfolded conformers.
Figures
Similar articles
-
Lysozyme amyloidogenesis is accelerated by specific nicking and fragmentation but decelerated by intact protein binding and conversion.J Mol Biol. 2007 Feb 23;366(3):1029-44. doi: 10.1016/j.jmb.2006.11.084. Epub 2006 Dec 2. J Mol Biol. 2007. PMID: 17196616
-
Guanidine hydrochloride can induce amyloid fibril formation from hen egg-white lysozyme.Biomacromolecules. 2004 Jul-Aug;5(4):1362-70. doi: 10.1021/bm0498979. Biomacromolecules. 2004. PMID: 15244452
-
Pressure-jump NMR study of dissociation and association of amyloid protofibrils.J Mol Biol. 2005 Jun 24;349(5):916-21. doi: 10.1016/j.jmb.2005.04.010. J Mol Biol. 2005. PMID: 15907935
-
Protein denaturation and aggregation: Cellular responses to denatured and aggregated proteins.Ann N Y Acad Sci. 2005 Dec;1066:181-221. doi: 10.1196/annals.1363.030. Ann N Y Acad Sci. 2005. PMID: 16533927 Review.
-
Amyloid fibril formation and disaggregation of fragment 1-29 of apomyoglobin: insights into the effect of pH on protein fibrillogenesis.J Mol Biol. 2007 Apr 13;367(5):1237-45. doi: 10.1016/j.jmb.2007.01.072. Epub 2007 Feb 3. J Mol Biol. 2007. PMID: 17320902 Review.
Cited by
-
Reversible aggregation plays a crucial role on the folding landscape of p53 core domain.Biophys J. 2004 Oct;87(4):2691-700. doi: 10.1529/biophysj.104.044685. Epub 2004 Aug 6. Biophys J. 2004. PMID: 15298872 Free PMC article.
-
Ligand binding and hydration in protein misfolding: insights from studies of prion and p53 tumor suppressor proteins.Acc Chem Res. 2010 Feb 16;43(2):271-9. doi: 10.1021/ar900179t. Acc Chem Res. 2010. PMID: 19817406 Free PMC article. Review.
-
Amyloid formation in denatured single-mutant lysozymes where residual structures are modulated.Protein Sci. 2006 Oct;15(10):2448-52. doi: 10.1110/ps.062258206. Epub 2006 Sep 8. Protein Sci. 2006. PMID: 16963644 Free PMC article.
-
Preventing disulfide bond formation weakens non-covalent forces among lysozyme aggregates.PLoS One. 2014 Feb 14;9(2):e87012. doi: 10.1371/journal.pone.0087012. eCollection 2014. PLoS One. 2014. PMID: 24551048 Free PMC article.
-
Real-time nuclear magnetic resonance spectroscopy in the study of biomolecular kinetics and dynamics.Magn Reson (Gott). 2021 May 11;2(1):291-320. doi: 10.5194/mr-2-291-2021. eCollection 2021. Magn Reson (Gott). 2021. PMID: 37904763 Free PMC article. Review.
References
-
- Dobson, C. M. (1999) Trends Biochem. Sci. 24, 329–332. - PubMed
-
- Konno, T., Murata, K. & Nagayama, K. (1999) FEBS Lett. 454, 122–126. - PubMed
-
- Fändrich, M., Fletcher, M. A. & Dobson, C. M. (2001) Nature 410, 165–166. - PubMed
-
- Fink, A. L. (1998) Fold. Des. 3, R9–R23. - PubMed
-
- Kelly, J. W. (1998) Curr. Opin. Struct. Biol. 8, 101–106. - PubMed
Publication types
MeSH terms
Substances
LinkOut - more resources
Full Text Sources
