. 2004 Mar 23;101(12):4083-8.
doi: 10.1073/pnas.0307332101. Epub 2004 Mar 11.

Modulation of the bilayer thickness of exocytic pathway membranes by membrane proteins rather than cholesterol

Affiliations

Modulation of the bilayer thickness of exocytic pathway membranes by membrane proteins rather than cholesterol

Kakoli Mitra et al. Proc Natl Acad Sci U S A. .

Abstract

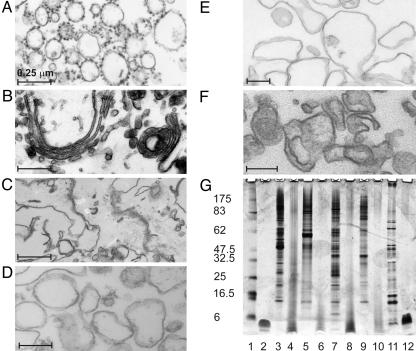
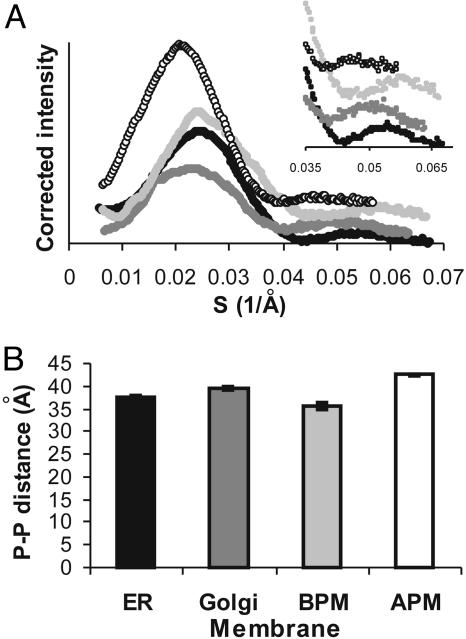
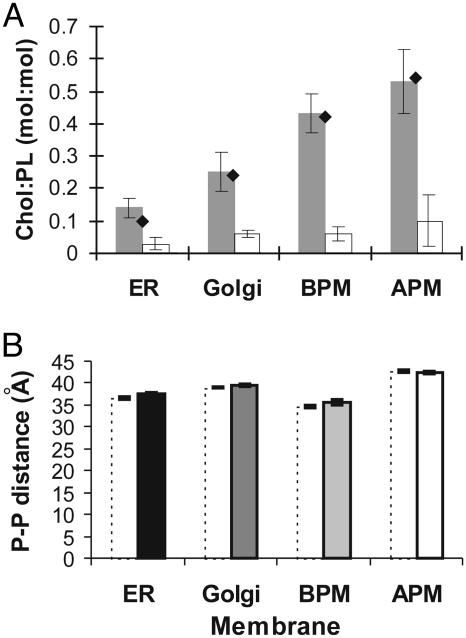
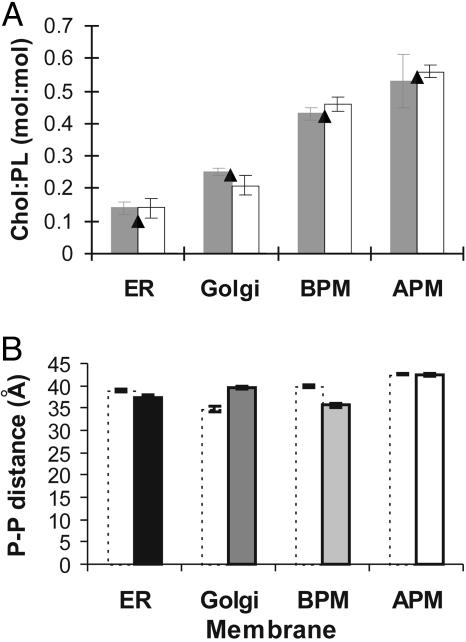
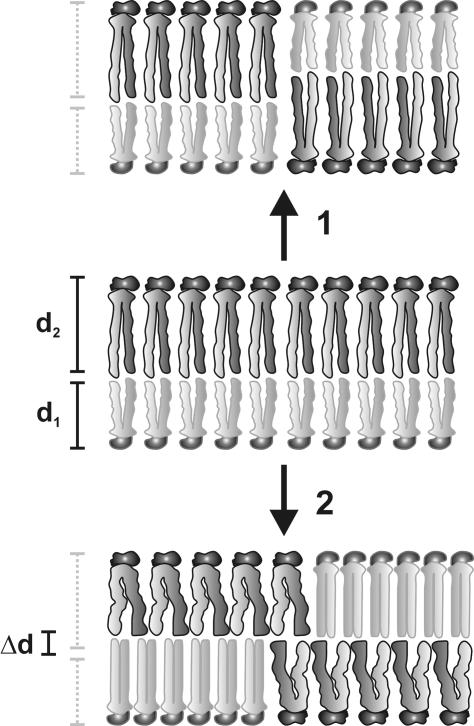
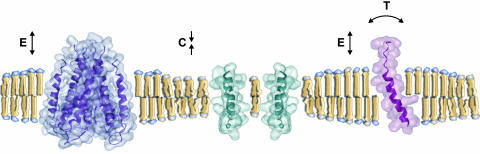
A biological membrane is conceptualized as a system in which membrane proteins are naturally matched to the equilibrium thickness of the lipid bilayer. Cholesterol, in addition to lipid composition, has been suggested to be a major regulator of bilayer thickness in vivo because measurements in vitro have shown that cholesterol can increase the thickness of simple phospholipid/cholesterol bilayers. Using solution x-ray scattering, we have directly measured the average bilayer thickness of exocytic pathway membranes, which contain increasing amounts of cholesterol. The bilayer thickness of membranes of the endoplasmic reticulum, the Golgi, and the basolateral and apical plasma membranes, purified from rat hepatocytes, were determined to be 37.5 +/- 0.4 A, 39.5 +/- 0.4 A, 35.6 +/- 0.6 A, and 42.5 +/- 0.3 A, respectively. After cholesterol depletion using cyclodextrins, Golgi and apical plasma membranes retained their respective bilayer thicknesses whereas the bilayer thickness of the endoplasmic reticulum and the basolateral plasma membrane decreased by 1.0 A. Because cholesterol was shown to have a marginal effect on the thickness of these membranes, we measured whether membrane proteins could modulate thickness. Protein-depleted membranes demonstrated changes in thickness of up to 5 A, suggesting that (i) membrane proteins rather than cholesterol modulate the average bilayer thickness of eukaryotic cell membranes, and (ii) proteins and lipids are not naturally hydrophobically matched in some biological membranes. A marked effect of membrane proteins on the thickness of Escherichia coli cytoplasmic membranes, which do not contain cholesterol, was also observed, emphasizing the generality of our findings.


Figures

Fig. 1.
Fig. 1.
Characterization of membrane samples. Electron micrographs of embedded, sectioned, and stained membranes isolated from rat hepatocytes. Shown are rough ER microsomes (A), Golgi membranes (B), mixed plasma membranes (C), basolateral (D) and apical (E) plasma membrane vesicles, and protease-treated ER microsomes (F). Scale bar corresponds to 0.25 μm. (G) Silver-stained 4–12% Bistris SDS/PAGE of membrane fractions. Shown are molecular mass markers (lane 1); 3.5-kDa transmembrane peptide, Gp55 (lane 2); ER microsomes before (lane 3) and after (lane 4) protease treatment; Golgi membranes before (lane 5) and after (lane 6) protease treatment; basolateral plasma membranes before (lane 7) and after (lane 8) protease treatment; apical plasma membranes before (lane 9) and after (lane 10) protease treatment; and E. coli cytoplasmic membranes before (lane 11) and after (lane 12) protease treatment.
Fig. 2.
Fig. 2.
Bilayer thicknesses of membranes along the exocytic pathway of rat hepatocytes. (A) Corrected scattering curves from SXS measurements of ER membranes (filled circles), Golgi membranes (dark gray circles), basolateral plasma membranes (BPM, light gray circles), and apical plasma membranes (APM, open circles). (Inset) Second maxima. (B) Mean phosphate-to-phosphate (P-P) distances calculated from the second maxima in A, with error bars from repeated measurements.
Fig. 3.
Fig. 3.
Effect of cholesterol depletion on bilayer thickness. (A) Cholesterol to phospholipid (Chol:PL) molar ratios of membranes before (shaded columns), and after (open columns) incubation with cyclodextrins. For comparison, the cholesterol content of intact membranes as calculated from the literature (–23) is given (filled diamonds). Standard deviations from repeated measurements are indicated. BPM, basolateral plasma membrane; APM, apical plasma membrane. (B) Mean phosphate-to-phosphate (P-P) distances of cholesterol-depleted membranes (dotted columns) of the ER and Golgi, and basolateral (BPM) and apical (APM) plasma membranes. Distances are calculated from second maxima, with error bars shown. The thickness values before cholesterol depletion are shown for reference (filled columns).
Fig. 4.
Fig. 4.
Effect of protein depletion on bilayer thickness. (A) Cholesterol to phospholipid (Chol:PL) molar ratios of membranes before (gray columns) and after (open columns) protein depletion. For comparison, the cholesterol content of intact membranes (see Fig. 3) is given (filled triangles). Standard deviations from repeated measurements are indicated. BPM, basolateral plasma membrane; APM, apical plasma membrane. (B) Mean phosphate-to-phosphate (P-P) distances of protein-depleted membranes (dotted columns) of the ER and Golgi, and basolateral (BPM) and apical (APM) plasma membranes. Distances are calculated from second maxima, with error bars shown. The thickness values before protein depletion are shown for reference (filled columns).
Fig. 5.
Fig. 5.
Thickness of model bilayers with symmetric or asymmetric lipid distributions. An asymmetric bilayer (Middle) with two lipid components, L1, in the inner leaflet, and L2, in the outer leaflet, with thicknesses d1 and d2, respectively, has a total thickness of d1 + d2. On loss of asymmetry, L1 and L2 are distributed equally in both leaflets. In 1, d1 and d2 are unchanged; hence, the total thickness remains d1 + d2. In 2, both lipids undergo conformational changes to hydrophobically match each other, with L1 extending by a distance Δd and L2 compressing by Δd, resulting in a total bilayer thickness of d1 + d2.
Fig. 6.
Fig. 6.
Modified view of the structure of a biological membrane. Because component lipids and proteins are not naturally matched in this membrane, they must strain (expend energy) to match each other hydrophobically, resulting in a high-energy membrane. Compensatory conformational changes include lipid acyl chain extension (E) and transmembrane helix tilting (T) when lipids surround a protein with a long transmembrane region, and lipid acyl chain compression (C) when lipids surround a protein with a short transmembrane domain.

References

    1. Mouritsen, O. G. & Bloom, M. (1984) Biophys. J. 46, 141–153. - PMC - PubMed
    1. Killian, J. A. (1998) Biochim. Biophys. Acta 1376, 401–415. - PubMed
    1. Cornelius, F. (2001) Biochemistry 40, 8842–8851. - PubMed
    1. Johannsson, A., Smith, G. A. & Metcalfe, J. C. (1981) Biochim. Biophys. Acta 641, 416–421. - PubMed
    1. Montecucco, C., Smith, G. A., Dabbeni-sala, F., Johannsson, A., Galante, Y. M. & Bisson, R. (1982) FEBS Lett. 144, 145–148. - PubMed

Publication types