

Profound influence of microarray scanner characteristics on gene expression ratios: analysis and procedure for correction
- PMID: 15018648
- PMCID: PMC356910
- DOI: 10.1186/1471-2164-5-10
Profound influence of microarray scanner characteristics on gene expression ratios: analysis and procedure for correction
Abstract
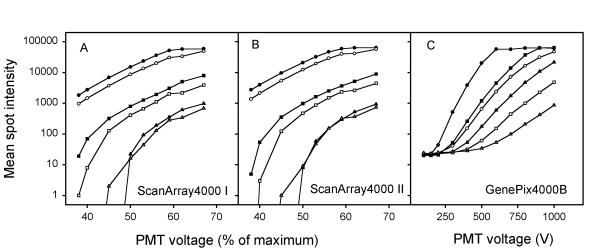
Background: High throughput gene expression data from spotted cDNA microarrays are collected by scanning the signal intensities of the corresponding spots by dedicated fluorescence scanners. The major scanner settings for increasing the spot intensities are the laser power and the voltage of the photomultiplier tube (PMT). It is required that the expression ratios are independent of these settings. We have investigated the relationships between PMT voltage, spot intensities, and expression ratios for different scanners, in order to define an optimal scanning procedure.
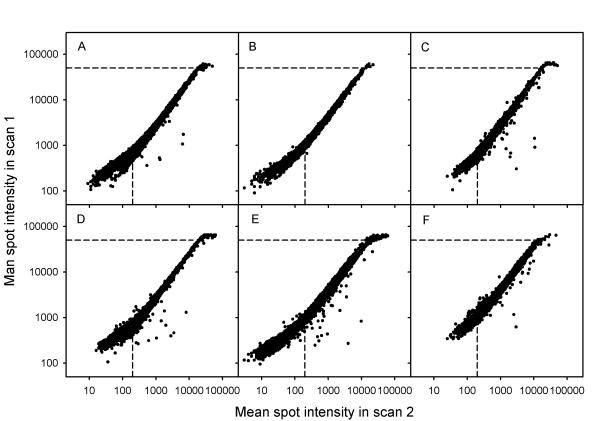
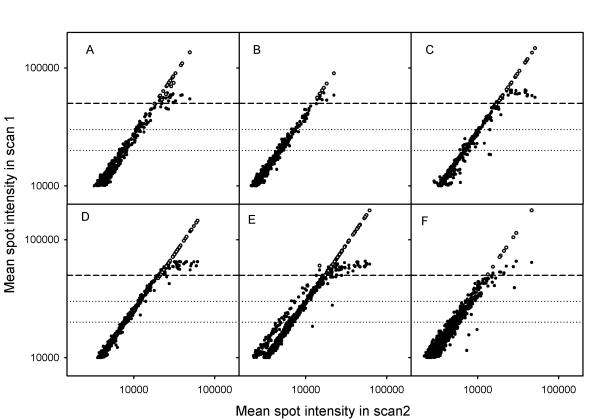
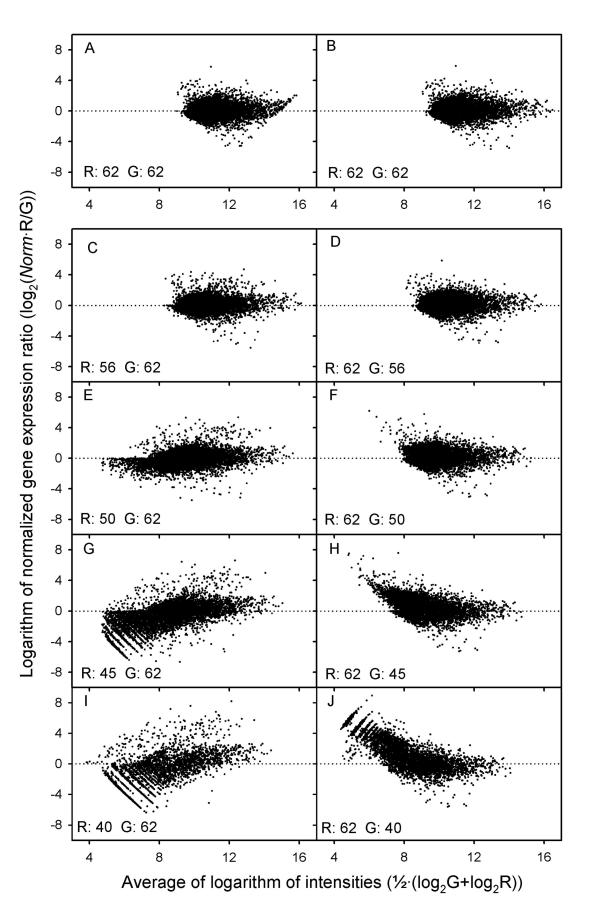
Results: All scanners showed a limited intensity range from 200 to 50 000 (mean spot intensity), for which the expression ratios were independent of PMT voltage. This usable intensity range was considerably less than the maximum detection range of the PMTs. The use of spot and background intensities outside this range led to errors in the ratios. The errors at high intensities were caused by saturation of pixel intensities within the spots. An algorithm was developed to correct the intensities of these spots, and, hence, extend the upper limit of the usable intensity range.
Conclusions: It is suggested that the PMT voltage should be increased to avoid intensities of the weakest spots below the usable range, allowing the brightest spots to reach the level of saturation. Subsequently, a second set of images should be acquired with a lower PMT setting such that no pixels are in saturation. Reliable data for spots with saturation in the first set of images can easily be extracted from the second set of images by the use of our algorithm. This procedure would lead to an increase in the accuracy of the data and in the number of data points achieved in each experiment compared to traditional procedures.
Figures
Similar articles
-
Combining multiple laser scans of spotted microarrays by means of a two-way ANOVA model.Stat Appl Genet Mol Biol. 2012 Feb 27;11(3):Article 8. doi: 10.1515/1544-6115.1738. Stat Appl Genet Mol Biol. 2012. PMID: 22499702
-
Effect of local background intensities in the normalization of cDNA microarray data with a skewed expression profiles.Exp Mol Med. 2002 Jul 31;34(3):224-32. doi: 10.1038/emm.2002.31. Exp Mol Med. 2002. PMID: 12216114
-
An algorithm for automatic evaluation of the spot quality in two-color DNA microarray experiments.BMC Bioinformatics. 2005 Dec 9;6:293. doi: 10.1186/1471-2105-6-293. BMC Bioinformatics. 2005. PMID: 16336688 Free PMC article.
-
Segmentation and intensity estimation of microarray images using a gamma-t mixture model.Bioinformatics. 2007 Feb 15;23(4):458-65. doi: 10.1093/bioinformatics/btl630. Epub 2006 Dec 12. Bioinformatics. 2007. PMID: 17166856
-
Improving reliability and performance of DNA microarrays.Expert Rev Mol Diagn. 2006 May;6(3):481-92. doi: 10.1586/14737159.6.3.481. Expert Rev Mol Diagn. 2006. PMID: 16706748 Review.
Cited by
-
Optimization of cDNA microarrays procedures using criteria that do not rely on external standards.BMC Genomics. 2007 Oct 18;8:377. doi: 10.1186/1471-2164-8-377. BMC Genomics. 2007. PMID: 17949480 Free PMC article.
-
Comparability and reproducibility of biomedical data.Brief Bioinform. 2013 Jul;14(4):391-401. doi: 10.1093/bib/bbs078. Epub 2012 Nov 27. Brief Bioinform. 2013. PMID: 23193203 Free PMC article. Review.
-
Aptamer Microarrays-Current Status and Future Prospects.Microarrays (Basel). 2015 Mar 24;4(2):115-32. doi: 10.3390/microarrays4020115. Microarrays (Basel). 2015. PMID: 27600216 Free PMC article. Review.
-
Hepatic gene expression response to acute indomethacin exposure.Mol Diagn Ther. 2006;10(3):187-96. doi: 10.1007/BF03256457. Mol Diagn Ther. 2006. PMID: 16771604
-
In control: systematic assessment of microarray performance.EMBO Rep. 2004 Oct;5(10):964-9. doi: 10.1038/sj.embor.7400253. EMBO Rep. 2004. PMID: 15459748 Free PMC article. Review.
References
Publication types
MeSH terms
Substances
LinkOut - more resources
Full Text Sources
