

doi: 10.1016/j.jtbi.2003.11.014.
Simulating the SARS outbreak in Beijing with limited data
Affiliations
- PMID: 15019504
- PMCID: PMC7134597
- DOI: 10.1016/j.jtbi.2003.11.014
Item in Clipboard
Simulating the SARS outbreak in Beijing with limited data
J Theor Biol.
.
Abstract
We propose a mathematical model to simulate the SARS outbreak in Beijing. The model consists of six subpopulations, namely susceptible, exposed, quarantined, suspect, probable and removed, as China started to report SARS cases as suspect and probable separately from April 27 and cases transferred from suspect class to probable class from May 2. By simplifying the model to a two-compartment suspect-probable model and a single-compartment probable model and using limited data, we are able to simulate the SARS outbreak in Beijing. We estimate that the reproduction number varies from 1.0698 to 3.2524 and obtain certain important epidemiological parameters.
Figures
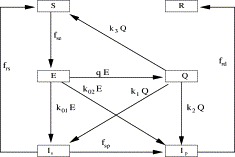
The schematic flow diagram for the general model consisting of susceptible (S), exposed (E), quarantine (Q), suspect (Is), probable (Ip) and removed (R) classes.
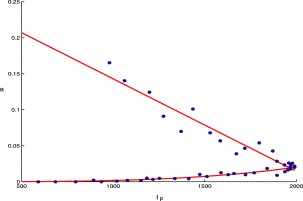
The graph of a(Ip) versus Ip, where the dots represent f0/Ip specified by the data in Table 1.
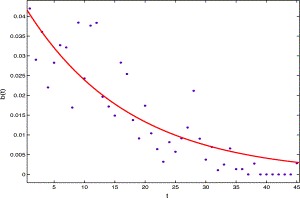
The per capita transition rate from Is class to Ip class versus time t, the solid line is b(t) and the dots represent the data from Table 1.
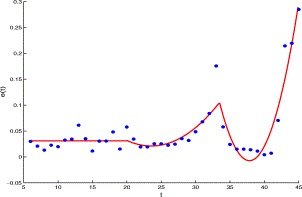
The per capita clear rate of the suspect versus time t, the solid line is made from e(t) and the dots represent the data from Table 1.
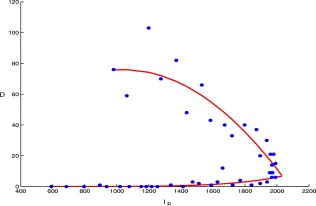
The direct transition rate from the E and Q compartments to Ip compartment versus Ip, the solid line is made from D(Ip) and the dots are plotted using the data in Table 1.
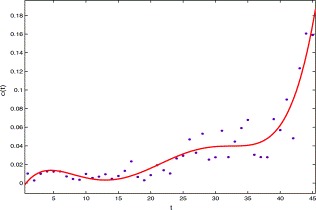
The graph of the per capita removal rate of probable class versus time t, the solid line is made from c(t) and the dots are made from the data in Table 1.
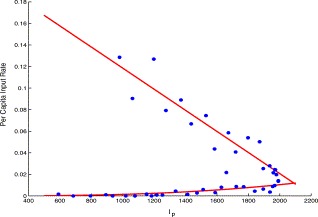
The per capita input rate of probable individuals to Ip compartment versus Ip, the solid lines represent β(Ip) and the dots are plotted using the data in Table 1.
Comparison of the simulation result (solid curve) from the suspect-probable model (3.6) and the reported data (dotted curve) from Table 1 of the suspect SARS cases, Is.

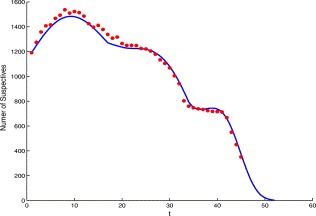
Comparison of the simulation result (solid curve) using the probable model (3.8) and the reported data (dotted curve) from Table 1 of the probable SARS cases, Ip. Here Ip(1)=980.
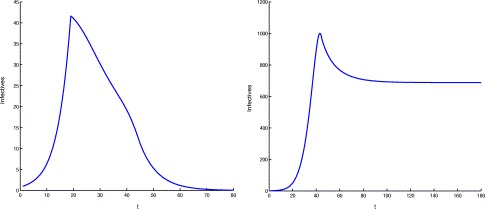
The computer simulations of probable cases when one infectious individual enters a completely susceptible population. The left figure shows the dynamics when protection measures are taken and the maximal control measures are maintained, while in the right one the maximal control measures were not maintained.
References
-
- Anderson R.M., May R.M. Infectious Diseases of Humans. Oxford University Press; London: 1991.
-
- Brauer F., Castillo-Chavez C. Mathematical Models in Population Biology and Epidemiology. Springer; New York: 2000.
-
- Booth C.M., Matukas L.M., Tomlinson G.A., Rachlis A.R., Rose D.B., Dwosh H.A., Walmsley S.L., Mazzulli T., Avendano M., Derkach P., Ephtimios I.E., Kitai I., Mederski B.D., Shadowitz S.B., Gold W.L., Hawryluck L.A., Rea E., Chenkin J.S., Cescon D.W., Poutanen S.M., Detsky A.S. Clinical features and short-term outcomes of 144 patients with SARS in the Greater Toronto area. JAMA. 2003;289:1–9. - PubMed
Publication types
MeSH terms
LinkOut - more resources
Full Text Sources
Miscellaneous
