Comparative Study
. 2004 May;15(5):2449-55.
doi: 10.1091/mbc.e04-01-0045. Epub 2004 Mar 12.

Measuring the size of biological nanostructures with spatially modulated illumination microscopy

Affiliations
Comparative Study

Measuring the size of biological nanostructures with spatially modulated illumination microscopy

Sonya Martin et al. Mol Biol Cell. 2004 May.

Abstract

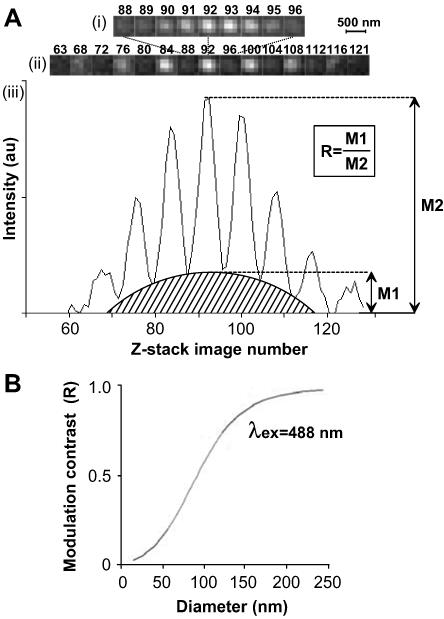
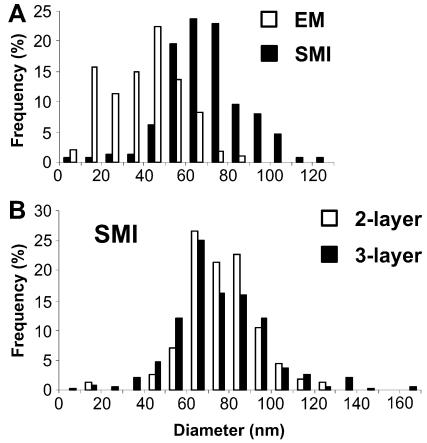
Spatially modulated illumination fluorescence microscopy can in theory measure the sizes of objects with a diameter ranging between 10 and 200 nm and has allowed accurate size measurement of subresolution fluorescent beads ( approximately 40-100 nm). Biological structures in this size range have so far been measured by electron microscopy. Here, we have labeled sites containing the active, hyperphosphorylated form of RNA polymerase II in the nucleus of HeLa cells by using the antibody H5. The spatially modulated illumination-microscope was compared with confocal laser scanning and electron microscopes and found to be suitable for measuring the size of cellular nanostructures in a biological setting. The hyperphosphorylated form of polymerase II was found in structures with a diameter of approximately 70 nm, well below the 200-nm resolution limit of standard fluorescence microscopes.


Figures

Figure 1.
Figure 1.
Measuring the size of fluorescent objects with SMI-microscopy. (A) The SMI-microscope uses two collimated lasers to produce a periodic excitation profile. (A) z-stack images of a 50-nm bead, collected at 20-nm intervals, show variation of emitted light, with the focal plane of the bead corresponding to image 92. i, images 88–96. ii, images corresponding to the brightest peaks and troughs throughout the stack, from image 63 to 121. (Note that the lateral resolution of the SMI-microscope is that of a wide-field microscope.) iii, emission profile representing the intensity values at coordinates located at the center of the bead for each image in the z-stack. The shape of the profile varies with the size of the object and the modulation contrast (R) is proportional to the size of the object in a wavelength-dependent manner. au, arbitrary units. (B) Calibration curve, computer simulated by virtual microscopy, for beads of different sizes, shows the relationship between the modulation contrast (R) and object size for 488-nm excitation wavelength. Experimental values for beads of sizes 40-, 50-, and 100-nm fit this curve. The diameter of structures can be obtained by interpolation of experimental values of R into this calibration curve.
Figure 3.
Figure 3.
Size of pol IIO sites obtained by SMI-microscopy and EM. (A) Pol IIO sites in cryosections (∼140 nm) were measured by SMI-microscopy (sites labeled as for Figure 2, A–C; 148 sites) and EM (sites labeled as for Figure 2D; 105 sites). The SMI-microscopy setup was that described in Albrecht et al. (2002). Sizes were grouped together into 10-nm ranges and frequencies expressed as a percentage of the total. Size measurements with EM (open bars) gave an average (weighted) diameter of 45 nm after correction for the contribution of polar caps (see text and Supporting Information, Part 3). Size measurements with SMI-microscopy (solid bars) gave an average (weighted) diameter of 74 nm (uncorrected as SMI-microscopy did not detect smaller/incomplete sites, see text and Supporting Information, Part 3). (B) Pol IIO sites were labeled for SMI-microscopy as described above (two-layer protocol) and with a three-layer protocol by using H5, rabbit anti-Ig antibodies and Alexa Fluor 488. The SMI-microscopy setup was improved by optimization of laser-camera alignment (Supporting Information, Part 1). Sizes were grouped as for A. Size measurements with the two-layer and three-layer protocols gave average (weighted) diameters of 82 nm (open bars) and 81 nm (solid bars), respectively.
Figure 2.
Figure 2.
Measuring the size of pol IIO discrete sites. Pol IIO occur as sites throughout the nucleoplasm in sites SMI-microscopy (A and B), CLSM (C), and EM (D) images. HeLa cells were fixed, embedded in sucrose, and cryosectioned (∼140 nm in thickness). Pol IIO was indirectly immunolabeled using mAb H5 and Alexa Fluor 488 (A–C) or 5-nm gold particles (D); sections were counter-stained with TOTO-3 (insets in A and C) or uranyl acetate (D), and images were collected with an SMI-microscope (A and B), CLSM (C), or EM (D). (A) An x,y image from the center of a z-stack of 160 images collected with the SMI-microscope. Due to the modulation of the incident light (see text), some sites cannot be seen in this image. (B) In a projected image of the 160 z-stack images, all sites detected by SMI-microscopy can be seen. The inset shows an enlarged view of several sites. (C) CLSM detects a greater number of sites, which are absent from nucleoli (arrowhead; see text). (D) On the EM, sites occur as clusters (arrowheads) of gold particles, and lone particles (arrow) represent nonspecific background; the inset shows an enlarged view of one cluster. EM detects the highest number of sites due to increased resolution. (E) Emission profile produced by the site circled in B (inset) giving a diameter of 51 nm.

References

    1. Albrecht, B., Failla, A.V., Schweitzer, A., and Cremer, C. (2002). Spatially modulated illumination microscopy allows axial distance resolution in the nanometer range. Appl. Opt. 41, 80–87. - PubMed
    1. Bailey, B., Farkas, D.L., Taylor, D.L., and Lanni, F. (1993). Enhancement of axial resolution in fluorescence microscopy by standing-wave excitation. Nature 366, 44–48. - PubMed
    1. Bregman, D.B., Du, L., Van Der Zee, S., and Warren, S.L. (1995). Transcription-dependent redistribution of the large subunit of RNA polymerase II to discrete nuclear domains. J. Cell Biol. 129, 287–298. - PMC - PubMed
    1. Egner, A., Jakobs, S., and Hell, S.W. (2002). Fast 100-nm resolution three-dimensional microscope reveals structural plasticity of mitochondria in live yeast. Proc. Natl. Acad. Sci. USA 99, 3370–3375. - PMC - PubMed
    1. Failla, A.V., Cavallo, A., and Cremer, C. (2002a). Subwavelength size determination by spatially modulated illumination virtual microscopy. Appl. Opt. 41, 6651–6659. - PubMed

Publication types

MeSH terms

Substances

LinkOut - more resources