

Self-reporting Arabidopsis expressing pH and [Ca2+] indicators unveil ion dynamics in the cytoplasm and in the apoplast under abiotic stress
- PMID: 15020753
- PMCID: PMC389913
- DOI: 10.1104/pp.103.032508
Self-reporting Arabidopsis expressing pH and [Ca2+] indicators unveil ion dynamics in the cytoplasm and in the apoplast under abiotic stress
Abstract
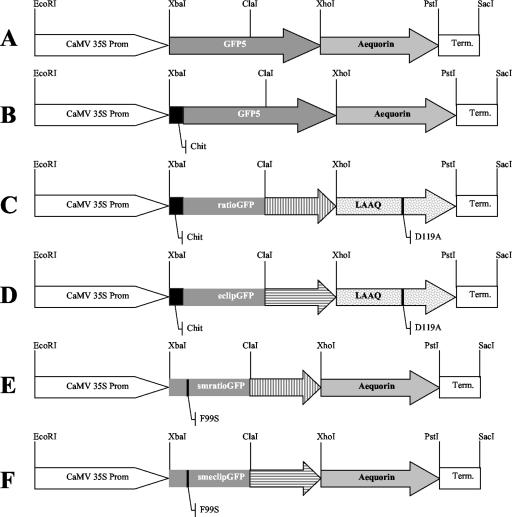
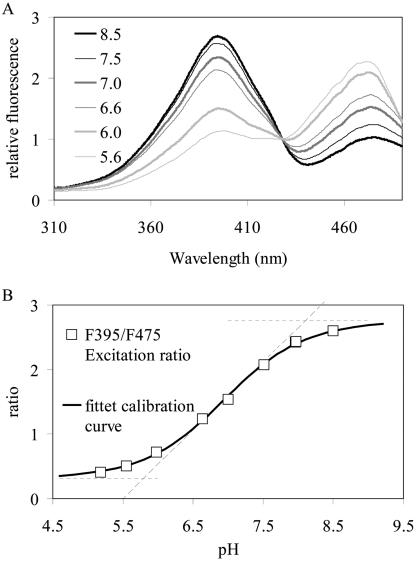
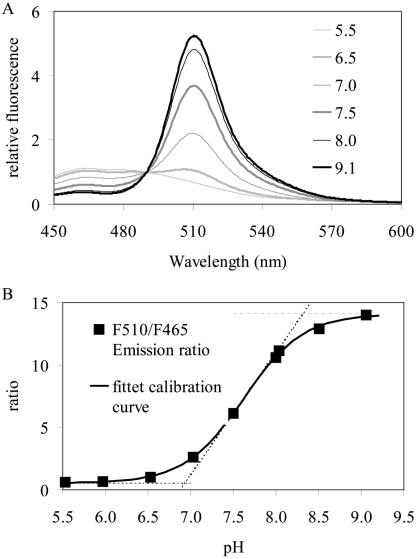
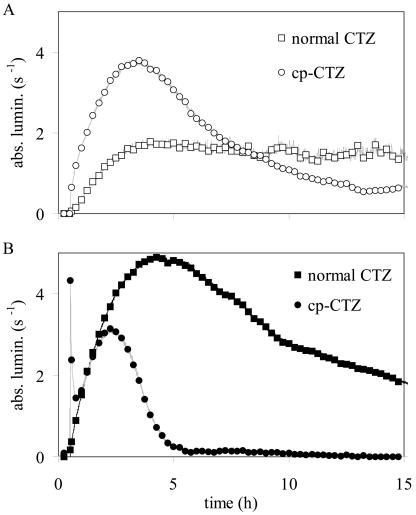
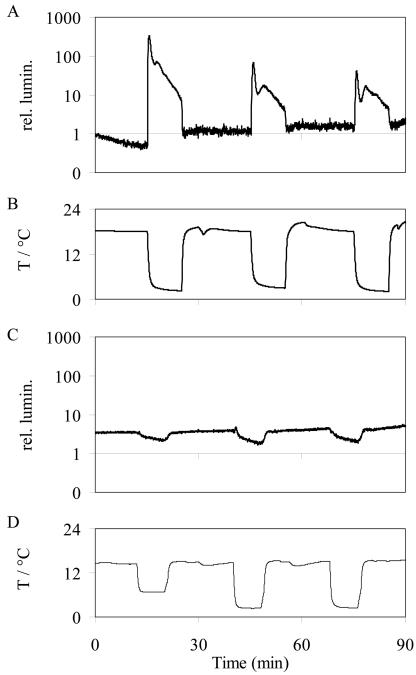
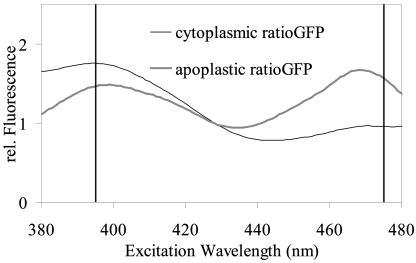
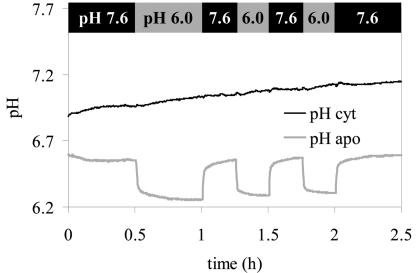
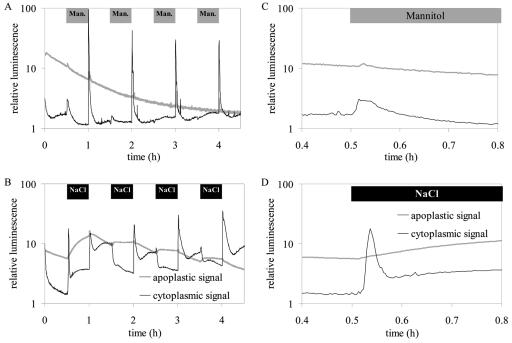
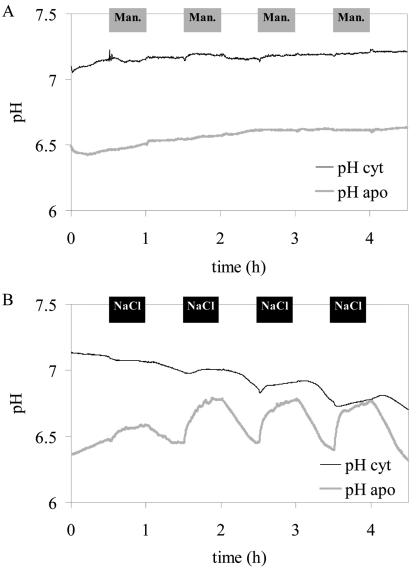
For noninvasive in vivo measurements of intra- and extracellular ion concentrations, we produced transgenic Arabidopsis expressing pH and calcium indicators in the cytoplasm and in the apoplast. Ratiometric pH-sensitive derivatives of the green fluorescent protein (At-pHluorins) were used as pH indicators. For measurements of calcium ([Ca(2+)]), luminescent aequorin variants were expressed in fusion with pHluorins. An Arabidopsis chitinase signal sequence was used to deliver the indicator complex to the apoplast. Responses of pH and [Ca(2+)] in the apoplast and in the cytoplasm were studied under salt and "drought" (mannitol) stress. Results are discussed in the frame of ion flux, regulation, and signaling. They suggest that osmotic stress and salt stress are differently sensed, compiled, and processed in plant cells.
Figures

Similar articles
-
Cell-type-specific calcium responses to drought, salt and cold in the Arabidopsis root.Plant J. 2000 Jul;23(2):267-78. doi: 10.1046/j.1365-313x.2000.00786.x. Plant J. 2000. PMID: 10929120
-
Mitochondrial and cytosolic calcium dynamics are differentially regulated in plants.Plant Physiol. 2003 Sep;133(1):21-4. doi: 10.1104/pp.103.026047. Plant Physiol. 2003. PMID: 12970470 Free PMC article. No abstract available.
-
The deposition of suberin lamellae determines the magnitude of cytosolic Ca2+ elevations in root endodermal cells subjected to cooling.Plant J. 2002 May;30(4):457-65. doi: 10.1046/j.1365-313x.2002.01306.x. Plant J. 2002. PMID: 12028575
-
Plant calcium signaling and monitoring: pros and cons and recent experimental approaches.Protoplasma. 2001;218(1-2):1-23. doi: 10.1007/BF01288356. Protoplasma. 2001. PMID: 11732314 Review.
-
pH, abscisic acid and the integration of metabolism in plants under stressed and non-stressed conditions. II. Modifications in modes of metabolism induced by variation in the tension on the water column and by stress.J Exp Bot. 2002 Feb;53(367):151-73. J Exp Bot. 2002. PMID: 11807119 Review.
Cited by
-
Analyses of Ca2+ accumulation and dynamics in the endoplasmic reticulum of Arabidopsis root cells using a genetically encoded Cameleon sensor.Plant Physiol. 2013 Nov;163(3):1230-41. doi: 10.1104/pp.113.226050. Epub 2013 Sep 30. Plant Physiol. 2013. PMID: 24082028 Free PMC article.
-
Splice isoform estrogen receptors as integral transmembrane proteins.Mol Biol Cell. 2011 Nov;22(22):4415-23. doi: 10.1091/mbc.E11-05-0416. Epub 2011 Sep 21. Mol Biol Cell. 2011. PMID: 21937726 Free PMC article.
-
Apoplastic sugars and cell-wall invertase are involved in formation of the tolerance of cold-resistant potato plants to hypothermia.Dokl Biochem Biophys. 2015;465:366-9. doi: 10.1134/S160767291506006X. Epub 2016 Jan 5. Dokl Biochem Biophys. 2015. PMID: 26728726
-
Salt-Induced Changes in Cytosolic pH and Photosynthesis in Tobacco and Potato Leaves.Int J Mol Sci. 2022 Dec 28;24(1):491. doi: 10.3390/ijms24010491. Int J Mol Sci. 2022. PMID: 36613934 Free PMC article.
-
Salicylic acid, yersiniabactin, and pyoverdin production by the model phytopathogen Pseudomonas syringae pv. tomato DC3000: synthesis, regulation, and impact on tomato and Arabidopsis host plants.J Bacteriol. 2007 Oct;189(19):6773-86. doi: 10.1128/JB.00827-07. Epub 2007 Jul 27. J Bacteriol. 2007. PMID: 17660289 Free PMC article.
References
-
- Amtmann A, Sanders D (1999) Mechanisms of Na+ uptake by plant cells. Adv Bot Res 29: 76-112
-
- Ausubel FM, Brent R, Kingston RE, Moore DD, Seidman JG, Smith JA, Struhl K (1999) Short Protocols in Molecular Biology. Wiley, New York
-
- Blatt MR, Grabov A (1997) Signal redundancy gates and integration in the control of ion channels for stomatal movement. J Exp Bot 48: 529-537 - PubMed
-
- Clough SJ, Bent AF (1998) Floral dip: a simplified method for Agrobacterium-mediated transformation of Arabidopsis thaliana. Plant J 16: 735-743 - PubMed
-
- Cramer GR, Jones RL (1996) Osmotic stress and abscisic acid reduce cytosolic calcium activities in roots of Arabidopsis thaliana. Plant Cell Environ 19: 1291-1298
Publication types
MeSH terms
Substances
LinkOut - more resources
Full Text Sources
Research Materials
Miscellaneous
