. 2004 Apr;123(4):357-76.
doi: 10.1085/jgp.200308964. Epub 2004 Mar 15.

Large diameter of palytoxin-induced Na/K pump channels and modulation of palytoxin interaction by Na/K pump ligands

Affiliations

Large diameter of palytoxin-induced Na/K pump channels and modulation of palytoxin interaction by Na/K pump ligands

Pablo Artigas et al. J Gen Physiol. 2004 Apr.

Abstract

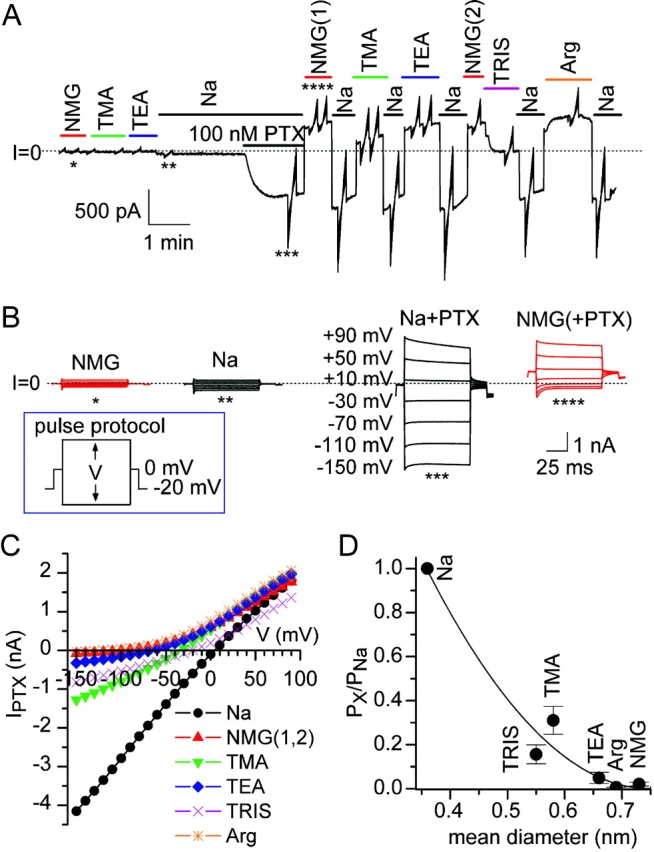
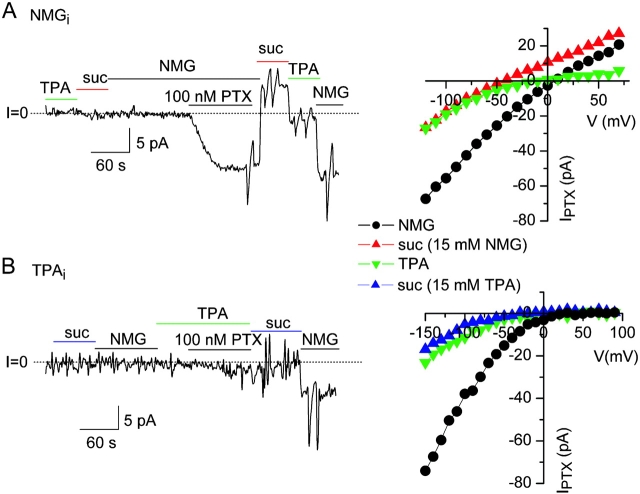
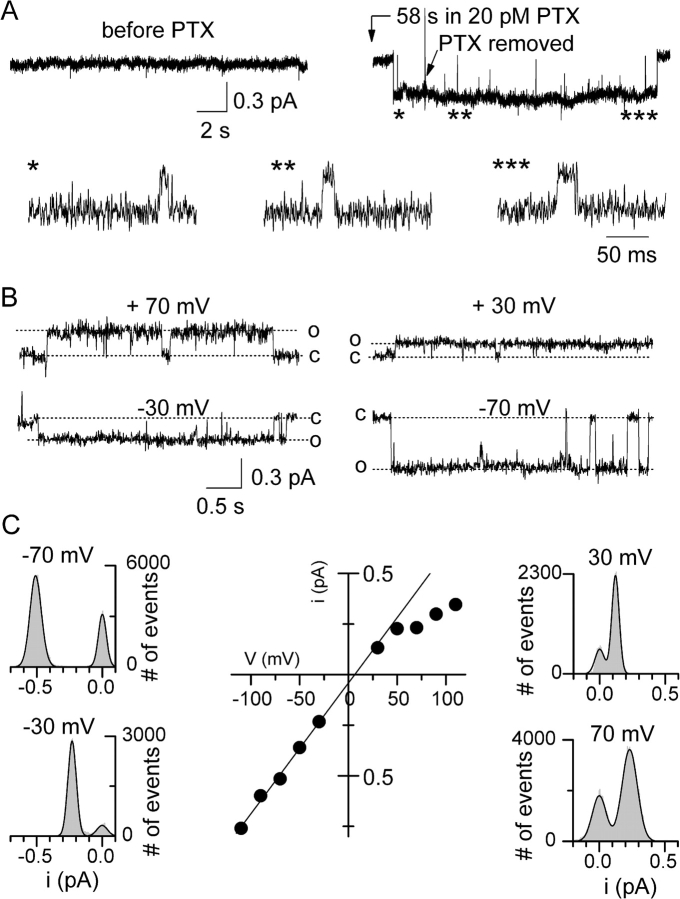
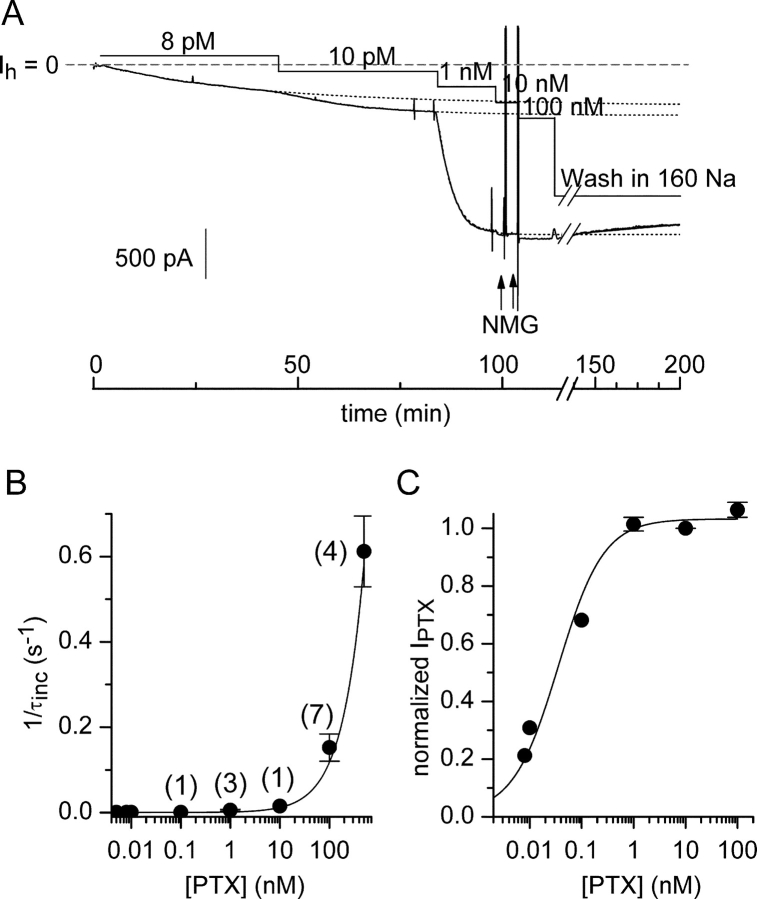
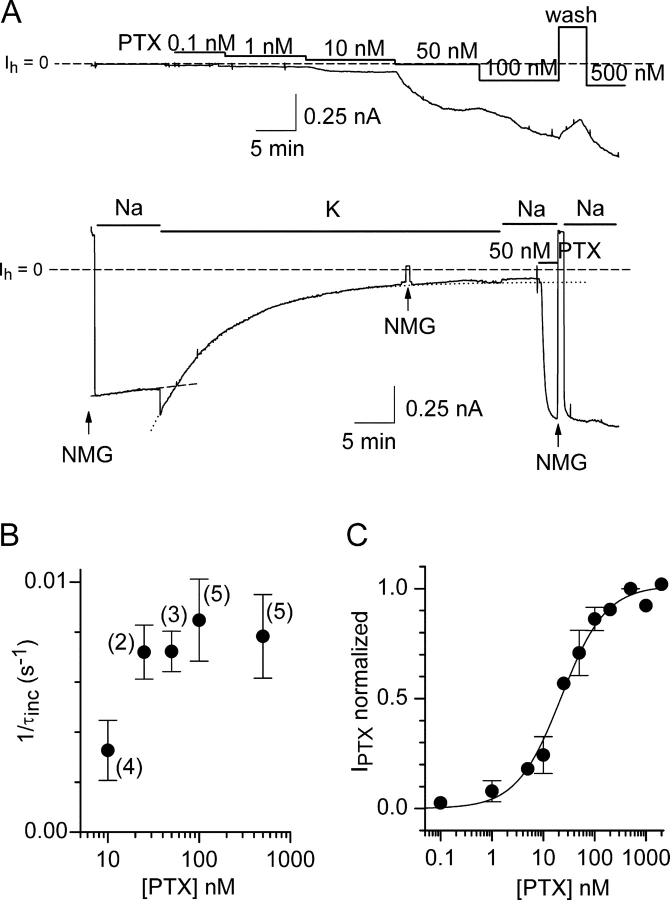
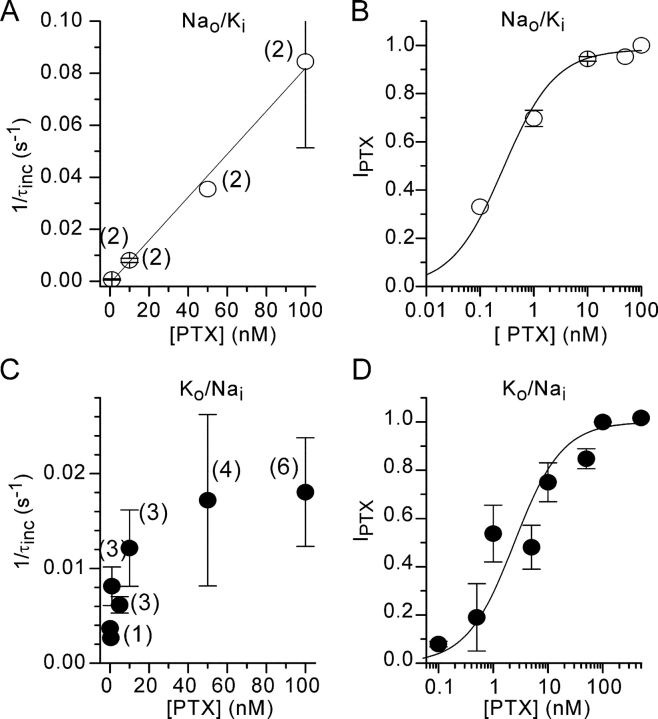
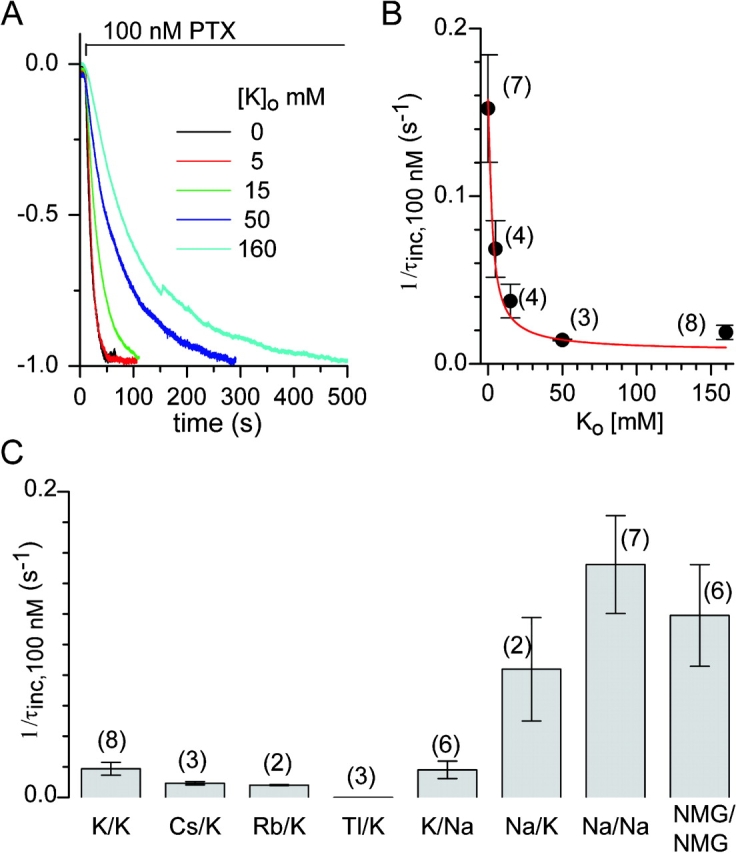
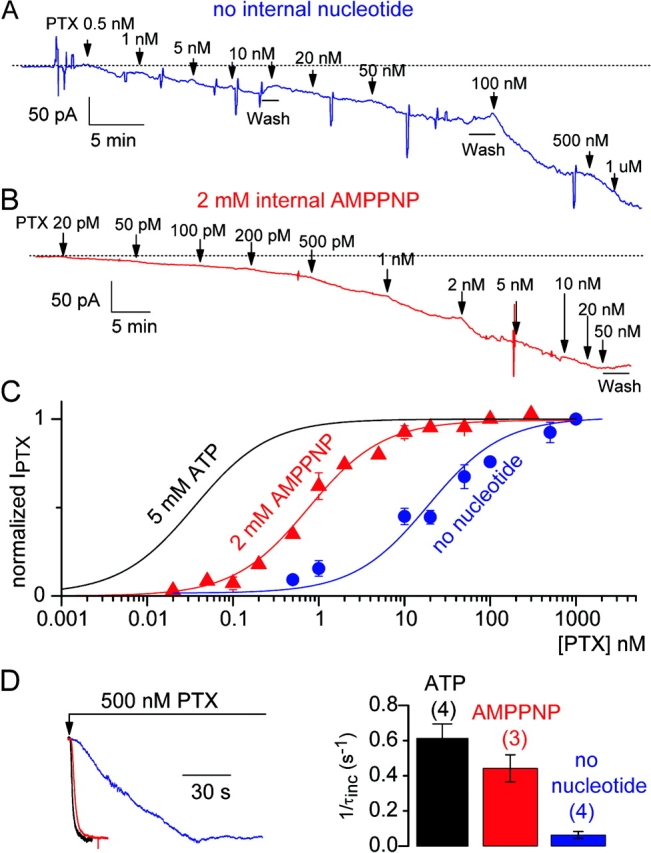
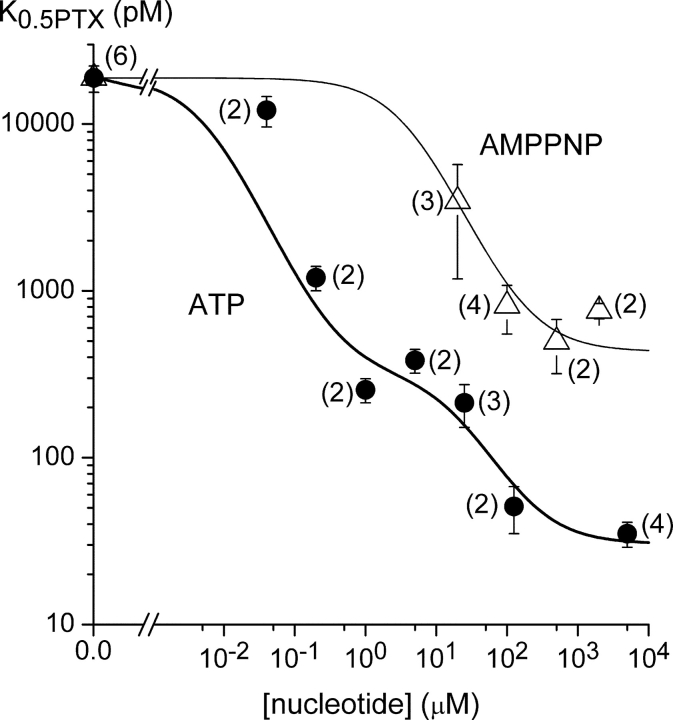
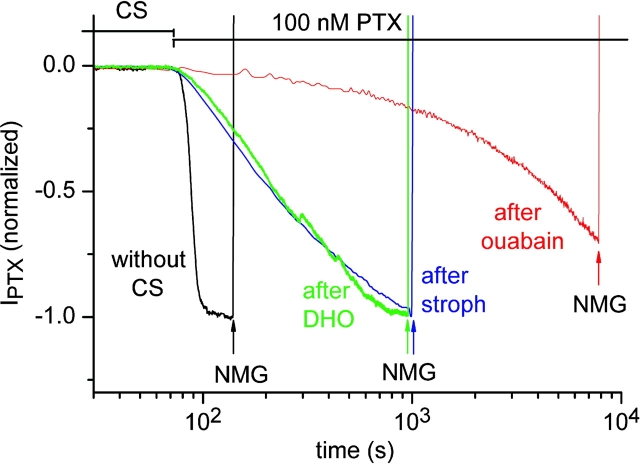
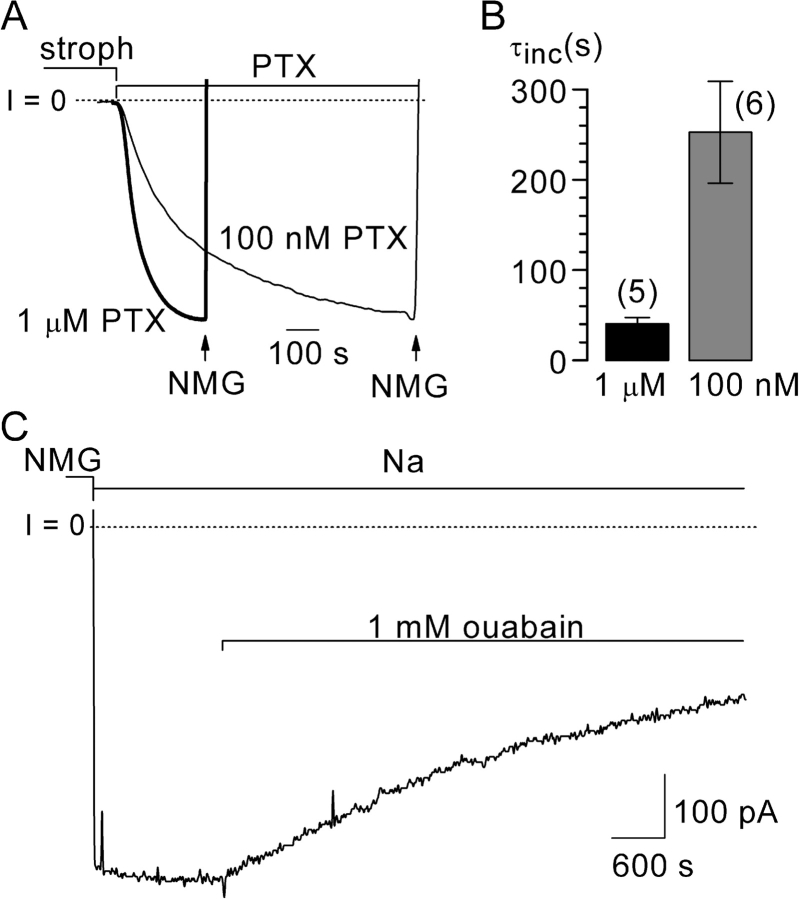
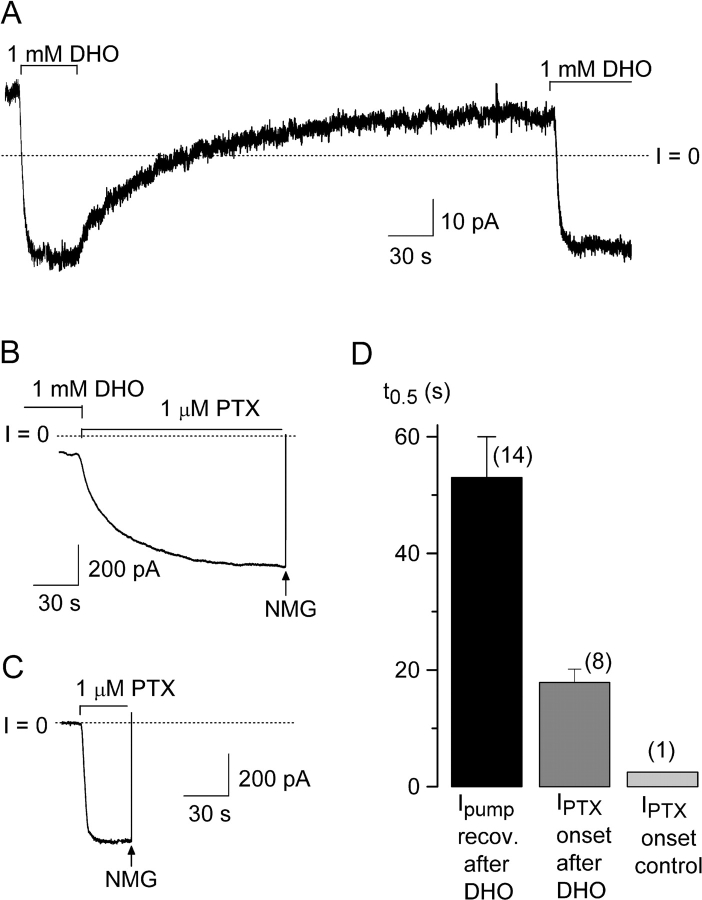
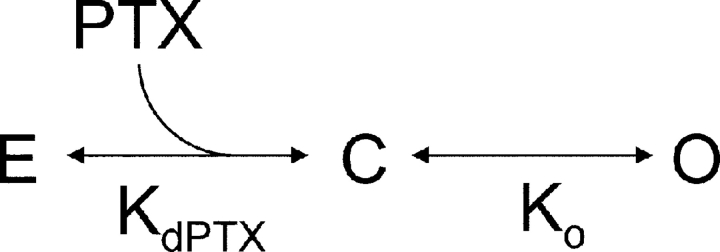
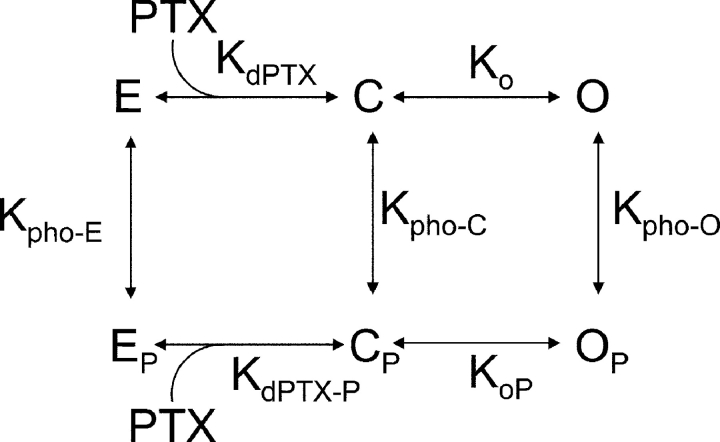
Palytoxin binds to Na/K pumps to generate nonselective cation channels whose pore likely comprises at least part of the pump's ion translocation pathway. We systematically analyzed palytoxin's interactions with native human Na/K pumps in outside-out patches from HEK293 cells over a broad range of ionic and nucleotide conditions, and with or without cardiotonic steroids. With 5 mM internal (pipette) [MgATP], palytoxin activated the conductance with an apparent affinity that was highest for Na(+)-containing (K(+)-free) external and internal solutions, lowest for K(+)-containing (Na(+)-free) external and internal solutions, and intermediate for the mixed external Na(+)/internal K(+), and external K(+)/internal Na(+) conditions; with Na(+) solutions and MgATP, the mean dwell time of palytoxin on the Na/K pump was about one day. With Na(+) solutions, the apparent affinity for palytoxin action was low after equilibration of patches with nucleotide-free pipette solution. That apparent affinity was increased in two phases as the equilibrating [MgATP] was raised over the submicromolar, and submillimolar, ranges, but was increased by pipette MgAMPPNP in a single phase, over the submillimolar range; the apparent affinity at saturating [MgAMPPNP] remained approximately 30-fold lower than at saturating [MgATP]. After palytoxin washout, the conductance decay that reflects palytoxin unbinding was accelerated by cardiotonic steroid. When Na/K pumps were preincubated with cardiotonic steroid, subsequent activation of palytoxin-induced conductance was greatly slowed, even after washout of the cardiotonic steroid, but activation could still be accelerated by increasing palytoxin concentration. These results indicate that palytoxin and a cardiotonic steroid can simultaneously occupy the same Na/K pump, each destabilizing the other. The palytoxin-induced channels were permeable to several large organic cations, including N-methyl-d-glucamine(+), suggesting that the narrowest section of the pore must be approximately 7.5 A wide. Enhanced understanding of palytoxin action now allows its use for examining the structures and mechanisms of the gates that occlude/deocclude transported ions during the normal Na/K pump cycle.


Figures

F<sc>igure</sc> 1.
Figure 1.
Permeation of organic monovalent cations through PTX-induced conductance pathway in outside-out patches from HEK293 cells with internal solution containing 150 mM Na+ and 5 mM MgATP. (A) Holding current at −20 mV throughout changes in principal external cation (160 mM in each case), and application of 100 nM PTX, indicated by colored and labeled horizontal bars over record; PTX increased inward current with time constant, τinc = 10 s. The vertical deflections reflect current changes (severely truncated due to the contracted time-scale) due to voltage steps. (B) Superimposed currents elicited (at times marked with asterisks in A) by the 80-ms steps to voltages (V) between −150 and +90 mV (using protocol shown in inset), shown on expanded time scale; for clarity, only every fourth trace is included. (C) PTX-induced current, IPTX, obtained as difference between currents (measured over ∼5 ms at end of each step) before and after addition of PTX, plotted against voltage (except that as Tris+ and arginine+ were not tested before PTX in this experiment currents in NMG+ and TMA+ before PTX, respectively, were used instead); though less obvious here, in 10 of 11 other patches, outward IPTX at V > +50 mV was 10–30% smaller when the external cation was NMG+ than when it was Na+. (D) PX/PNa estimates plotted against calculated mean diameter of cation X+; the line is the fit of PX/PNa = k(1 − (dX/dp))2 for ions of diameter dX traversing a water-filled pore of diameter dp = 7.5 Å, with proportionality constant k = 5.6 that incorporates the diameter of the hydrated Na+ ion (e.g., Dwyer et al., 1980).
F<sc>igure</sc> 2.
Figure 2.
NMG+, but not TPA+, ions permeate PTX-induced pathway. (A, left) Current at −20 mV in outside-out HEK293 cell patch with internal solution containing 160 mM NMG+ and 5 mM MgATP, and changes in external solutions indicated by bars over record. 100 nM PTX increased inward current (τinc = 18 s) in NMG+ solution, but current was unchanged in TPA+ and was outward after an ∼10-fold dilution with sucrose (suc, 15 mM NMG+). (Right) IPTX-V plots determined by subtraction (as in Fig. 1) of currents during 80-ms voltage steps applied (during deflections in record at left) in each solution before and after PTX application; note that external TPA+ reduced outward IPTX carried by NMG+. (B, left) As in A, but internal solution contained 160 mM TPA+; 100 nM PTX did not increase current at −20 mV in TPA+ external solution but did increase inward current in NMG+. (Right) Resulting IPTX-V plots (from experiment at left) showing inward current carried by NMG+ but absence of inward and outward TPA+ current.
F<sc>igure</sc> 3.
Figure 3.
Small-conductance channels underlie PTX-induced current. (A, top left) Absence of channel activity in an outside-out ventricular-myocyte patch held at −40 mV, with external and internal Na+ solutions and 5 mM internal MgATP, before PTX application. (Right) A single PTX-induced channel opened ∼1 min after application of 20 pM PTX and its activity, characterized by long open bursts with brief closures (e.g., asterisks), continued long after PTX washout. (Bottom) Examples of brief intraburst closures (asterisks, above) shown on expanded time scale; no baseline subtraction was used. (B) Records of current through same channel as in A at indicated voltages, several min after PTX withdrawal; channel closed (c) and open (o) current levels are marked (baseline was corrected for a linear slope). (C, left and right) All-point histograms of baseline-corrected records ≥20 s long (hence not representative of open probability), fitted with sums of two Gaussians. (Center) Single-channel current, i (differences between Gaussian peaks), plotted against V; linear fit to data at negative V gave channel conductance of 7 pS.
F<sc>igure</sc> 4.
Figure 4.
Dependence on [PTX] of IPTX activation rate and magnitude in outside-out HEK293 cell patches, at −20 mV, with external and internal Na+ solutions and 5 mM internal MgATP. (A) The inward current increase in response to each increment in [PTX] was approximately exponential (dotted fit lines), with τinc = 1,971 s at 8 pM, 1,442 s at 10 pM, and 210 s at 1 nM PTX; dashed line marks zero holding current, Ih. Note contraction of slow time scale after PTX washout; exponential fit (line obscured by data points) to IPTX decay (to Ih = 0) gave τdec = 105 s. Brief switches to external solution with all Na+ replaced by NMG+ (arrows labeled NMG) verified absence of seal breakdown, as the reversal potential of PTX-induced current with external NMG+ and internal Na+ is approximately −90 mV (e.g., Fig. 1), whereas that for the conductance of a broken seal is not far from 0 mV. (B) Mean (±SEM) rate of activation of IPTX (1/τinc) from exponential fits in 1–7 experiments as in A (one experiment each at 5, 8, and 10 pM), plotted against log [PTX]. The line shows a least-squares linear fit of 1/τinc = kon[PTX] + k*off to the data (but with k*off fixed at 0 s−1), yielding kon = 1.4 (±0.1) × 106 M−1s−1. (C) Estimated (from the exponential fits as in A) steady-state amplitude of IPTX (normalized to its level at 10 nM PTX) plotted against log [PTX]. The line shows a least-squares fit of a Michaelis function to the data from 4 patches, yielding K0.5PTX = 33 ± 7 pM.
F<sc>igure</sc> 5.
Figure 5.
Influence of K+ ions on interactions between PTX and Na/K pumps. (A) Activation of IPTX at −20 mV by incremental increases in [PTX] in an outside-out HEK293 cell patch with 160-mM external K+ and 150-mM internal K+ solution with 5 mM MgATP. IPTX requires [PTX] ≥ 1 nM and the activation rate (from exponential fits; omitted for clarity) saturated at 1/τinc ∼0.01 s−1 at high [PTX]. Lower record is continuation (∼2.5 min omitted) of upper experiment after PTX washout and brief switches to Na+ and then NMG+ external solution. Current decay was slow in Na+ external solution (τdec = 6,000 s; dashed exponential fit line), but rapid in K+ external solution (τdec = 500 s; dotted exponential fit line). After complete decay of IPTX, note that reactivation of IPTX by 50 nM PTX was faster in Na+ external solution than it had been in K+ external solution. (B) Means (±SEM) of n (in parentheses) measurements of IPTX activation rate, 1/τinc, from exponential fits, plotted against log [PTX]. (C) Dependence on log [PTX] of steady-state amplitude of IPTX (estimated from exponential fits) normalized to its level at 500 nM PTX. The line shows a least-squares fit of a Michaelis function to the data from seven patches, yielding K0.5PTX = 22 ± 2 nM.
F<sc>igure</sc> 6.
Figure 6.
Dependence of IPTX activation rate and magnitude on [PTX] under mixed Na+ and K+ (biionic) conditions, from experiments on outside-out HEK293 cell patches as in Figs. 4 and 5. (A) Mean (±SEM, of n measurements) 1/τinc plotted against [PTX]. (B) Estimated steady amplitude (normalized to that at 100 nM PTX), of IPTX, from two patches plotted against log [PTX], determined with 160 mM external Na+ and 150 mM internal K+ solution with 5 mM MgATP. The line in A shows a fit to 1/τinc = kon[PTX] + k*off (with k*off fixed at the observed 10−4 s−1), yielding kon = 8.3 ± 0.3 × 10⁵ M−1s−1. The Michaelis fit in B gave K0.5PTX = 0.27 ± 0.07 nM. (C and D) Corresponding 1/τinc vs. [PTX], and estimated steady IPTX vs. log [PTX], respectively, from seven patches with 160 mM external K+ and 150 mM internal Na+ solution with 5 mM MgATP. The large error bars in C reflect patch-to-patch variation, as saturation of 1/τinc was a consistent finding in individual patches: thus 1/τinc(50 nM)/1/τinc(10 nM) = 1.5 ± 0.4 (n = 3). The Michaelis fit in D gave K0.5PTX = 2.4 ± 0.8 nM.
F<sc>igure</sc> 7.
Figure 7.
Slow activation of IPTX with K+ external solution is due to K+ binding at its transport sites. (A) Superimposed records of normalized IPTX activated by 100 nM PTX in outside-out patches (at −20 mV, with 150 mM Na+ and 5 mM MgATP in the pipette), showing slowing of activation by increasing external [K+] (with [K+]+[Na+] = 160 mM). (B) Mean (±SEM, of n measurements) 1/τinc for 100 nM PTX plotted against external [K+]; red line shows Michaelis fit yielding K0.5K = 2.4 ± 1.2 mM, 1/τinc(max)= 0.16 ± 0.03 s−1, and 1/τinc(min)= 0.007 ± 0.003 s−1. (C) Mean (±SEM, of n measurements) rates of IPTX activation by 100 nM PTX with indicated ionic conditions (external cation/internal cation): K+/K+, 0.019 ± 0.004 s−1; Cs+/K+, 0.009 ± 0.001 s; Rb+/K+, 0.008 ± 0.0004 s−1; Tl+/K+, 0 s−1; K+/Na+, 0.018± 0.004 s−1; Na+/K+, 0.084 ± 0.034 s−1; Na+/Na+, 0.15 ± 0.03 s−1; NMG+/NMG+, 0.12 ± 0.03 s−1.
F<sc>igure</sc> 8.
Figure 8.
PTX apparent affinity is reduced by ATP depletion. (A and B) Activation of IPTX at −20 mV by incremental increases in [PTX] in outside-out HEK293 cell patches with 160 mM external Na+ and 150 mM internal Na+ solutions, with either (A) no nucleotide or (B) 2 mM MgAMPPNP in the pipette. The discernible current decay elicited by even brief (100–150-s) wash periods indicates the more rapid unbinding of PTX in these solutions than with MgATP in the pipette (compare with Fig. 4 A, above). (C) Mean estimated steady IPTX amplitude (from exponential fits), normalized to that at 100 nM PTX, was plotted against log [PTX] and fitted with Michaelis functions, which gave K0.5PTX = 19 ± 3 nM for patches with no nucleotides (blue circles, n = 6) and K0.5PTX = 0.76 ± 0.08 nM with MgAMPPNP (red triangles, n = 2); for display, the data with no nucleotides were renormalized to IPTX(max) from the fit. The curve obtained with 5 mM MgATP (Fig. 4 C) is also shown (black line, K0.5PTX = 33 pM) for comparison. (D, left) Normalized records showing rate of IPTX activation by 500 nM PTX in outside-out patches with no nucleotide (blue trace), with 2 mM MgAMPPNP (red trace), or with 5 mM MgATP (black trace) in the internal solution. (Right) Bar graph summarizing 1/τinc: mean rates were 0.61 ± 0.08 s−1 with MgATP (black bar; n = 4), 0.44 ± 0.08 s−1 with MgAMPPNP (red bar; n = 3), and 0.06 ± 0.02 s−1 without nucleotide (blue bar; n = 4).
F<sc>igure</sc> 9.
Figure 9.
Dependence of K0.5PTX on type and concentration of internal nucleotide. Estimates of steady IPTX levels at several [PTX] were determined as in Figs. 4 A and 8, A and B, in outside-out HEK293 cell patches with Na+ external and internal solutions, but with one of a range of concentrations of MgATP or of MgAMPPNP in the pipette. For each [nucleotide], K0.5PTX was obtained from a Michaelis fit to the data from n patches and is shown plotted against [nucleotide] on log–log axes. The K0.5PTX values for 0 μM ≤ [MgATP] ≤ 5 mM (filled circles) are approximated (fitted line) by the sum of two Michaelis components (plus a constant, C) with amplitude and K0.5 parameters: A1 = 18.9 nM, K0.5ATP-1 = 5.5 nM, A2 = 280 pM, K0.5ATP-2 = 19 μM, and C = 20 pM. The K0.5PTX values for 0 μM ≤ [MgAMPPNP] ≤ 2 mM (open triangles) are described (fitted line) by a single Michaelis function (plus a constant, C) with parameters: A1 = 18.9 nM, K0.5AMPPNP = 4 μM, and C = 430 pM.
F<sc>igure</sc> 10.
Figure 10.
Preincubation with a cardiotonic steroid (CS) slows subsequent activation of IPTX by 100 nM PTX after washout of the steroid. Superimposed records of normalized (to the maximum from exponential fits) IPTX at −20 mV in outside-out HEK293 cell patches with Na+ external and internal solutions and 5 mM internal MgATP; note logarithmic time scale. PTX was applied after 5-min preincubations with 1 mM ouabain (red trace, τinc = 7250 s), or 0.5 mM strophanthidin (blue trace, τinc = 240 s), or 1 mM dihydroouabain (DHO, green trace, τinc = 257 s), or with no CS (black trace, τinc = 6 s).
F<sc>igure</sc> 11.
Figure 11.
PTX and ouabain can simultaneously occupy the same Na/K pump in HEK293 cells. (A) Superimposed representative normalized records of IPTX activation at −20 mV in outside-out HEK293 cell patches with Na+ external and internal solutions and 5 mM internal MgATP, after 5-min preincubation with 0.5 mM strophanthidin. IPTX increased more slowly with 100 nM PTX (thin trace) than with 1 μM PTX (thick trace). (B) Bar graph summarizing several (n) measurements: mean τinc was 256 ± 53 s with 100 nM PTX and 41 ± 7 s with 1 μM PTX. (C) Continuation of red trace from Fig. 10, after activation of IPTX in Na+ solution and 1.5 min of PTX washout in NMG+ solution; current did not decay for ∼20 min in Na+ solution until 1 mM ouabain was added.
F<sc>igure</sc> 12.
Figure 12.
PTX accelerates unbinding of cardiotonic steroids in ventricular myocytes. (A) Whole-cell current at −2 mV with 30 mM external Cs+ and 50 mM internal Na+; 1 mM DHO abolished outward Na/K pump current, Ipump, which recovered with t0.5 = 60 s after DHO washout. (B) During second exposure to DHO, an outside-out patch was excised from the myocyte in A, and 1 μM PTX was applied as DHO was withdrawn, activating IPTX with t0.5 = 20 s. (C) Rapid activation of IPTX with same solutions as in A and B, but with no DHO preincubation; patch from different myocyte. (D) Bar graph summarizing t0.5 values from experiments as in A–C.
SCHEME I
SCHEME I
SCHEME II
SCHEME II
SCHEME III
SCHEME III

Similar articles

Cited by

References

    1. Artigas, P., and D.C. Gadsby. 2003. a. Na+/K+ ligands modulate gating of palytoxin-induced ion channels. Proc. Natl. Acad. Sci. USA. 100:501–505. - PMC - PubMed
    1. Artigas, P., and D.C. Gadsby. 2003. b. Ion occlusion/deocclusion partial reactions in individual palytoxin-modified Na/K pumps. Ann. NY Acad. Sci. 986:116–126. - PubMed
    1. Ahnert-Hilger, G., G.S. Chhatwal, H.J. Hessler, and E. Habermann. 1982. Changes in erythrocyte permeability due to palytoxin as compared to amphotericin B. Biochim. Biophys. Acta. 688:486–494. - PubMed
    1. Ball, W.J., Jr., C.D. Farr, S. Paula, S.M. Keenan, R.K. Delisle, and W.J. Welsh. 2003. Three-dimensional structure-activity relationship modeling of digoxin inhibition and docking to Na+,K+-ATPase. Ann. NY Acad. Sci. 986:296–297. - PubMed
    1. Beaugé, L.A., and I.M. Glynn. 1979. Occlusion of k ions in the unphosphorylated sodium pump. Nature. 280:510–512. - PubMed

Publication types

MeSH terms