. 2004 Apr;24(7):2797-807.
doi: 10.1128/MCB.24.7.2797-2807.2004.

Phosphorylation controls Ikaros's ability to negatively regulate the G(1)-S transition

Affiliations

Phosphorylation controls Ikaros's ability to negatively regulate the G(1)-S transition

Pablo Gómez-del Arco et al. Mol Cell Biol. 2004 Apr.

Abstract

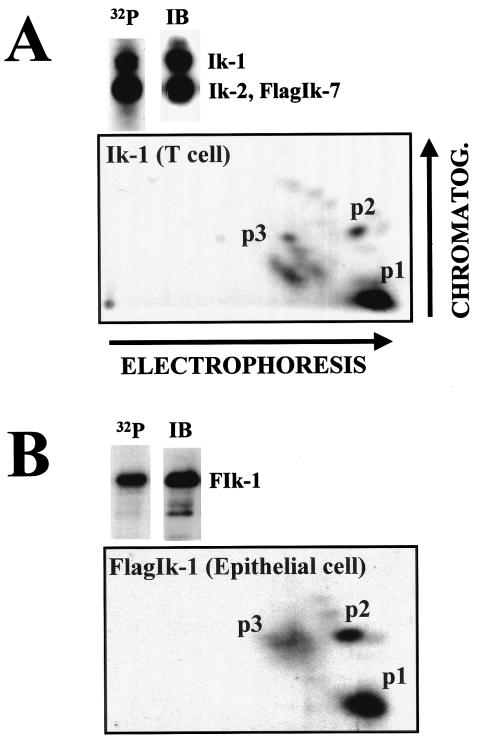
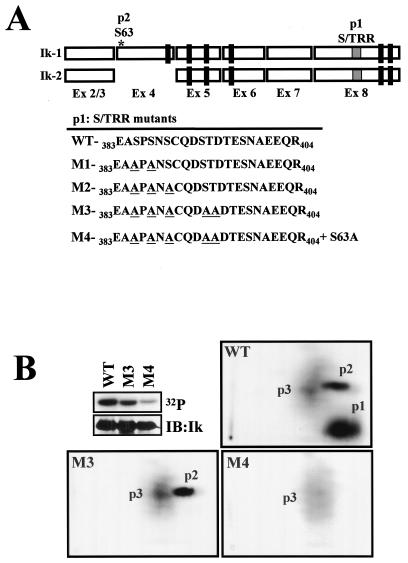
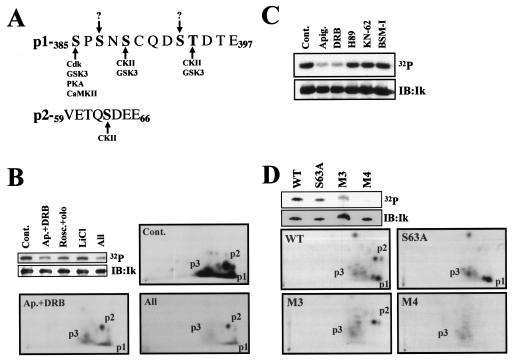
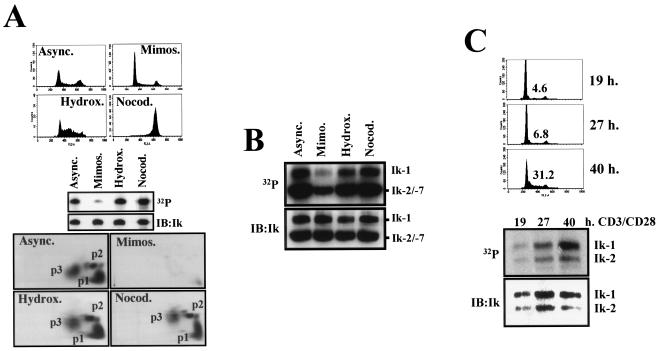
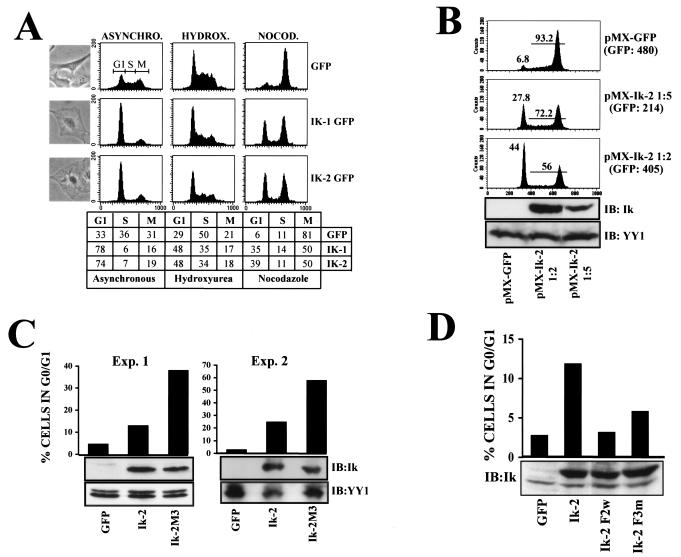
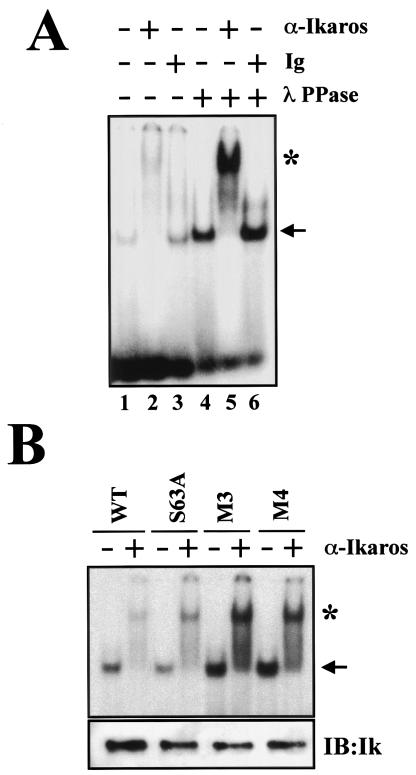
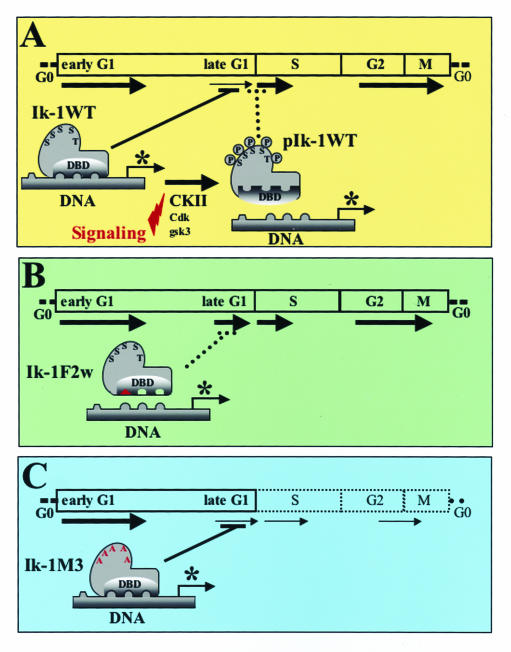
Ikaros is a key regulator of lymphocyte proliferative responses. Inactivating mutations in Ikaros cause antigen-mediated lymphocyte hyperproliferation and the rapid development of leukemia and lymphoma. Here we show that Ikaros's ability to negatively regulate the G(1)-S transition can be modulated by phosphorylation of a serine/threonine-rich conserved region (p1) in exon 8. Ikaros phosphorylation in p1 is induced during the G(1)-S transition. Mutations that prevent phosphorylation in p1 increase Ikaros's ability to impede cell cycle progression and its affinity for DNA. Casein kinase II, whose increased activity in lymphocytes leads to transformation, is a key player in Ikaros p1 phosphorylation. We thus propose that Ikaros's activity as a regulator of the G(1)-S transition is controlled by phosphorylation in response to signaling events that down-modulate its DNA binding activity.


Figures

FIG. 1.
FIG. 1.
The Ikaros phosphorylation pattern in lymphoid and nonlymphoid cells. (A) The T-cell line 510 was labeled in vivo with radioactive orthophosphate for 12 to 16 h. After immunoprecipitation (IP), Ikaros proteins were resolved by SDS-PAGE and transferred to nitrocellulose membranes. Radioactive signal was revealed by autoradiography of the membranes (32P), and proteins were determined by immunoblotting (IB) of the same membranes with anti-Ikaros antibody. The Ik-1 isoform was trypsinized, and the resulting peptides were separated first by electrophoresis and then by chromatography (CHROMATOG.) (3). The phosphorylated peptides were revealed by autoradiography. (B) 293T cells (epithelial cell line) were transfected with 5 μg of CMV2-FlagIk-1. Thirty-six hours posttransfection, cells were labeled with radioactive orthophosphate for an additional 12 to 16 h. After immunoprecipitation, FlagIk-1 was processed like in panel A. The major regions of phosphorylation 1, 2, and 3 (p1, p2, and p3, respectively) are indicated.
FIG. 2.
FIG. 2.
Characterization of the major phosphorylated residues in Ikaros. (A) Representation of Ik-1 and Ik-2 isoforms indicating the theoretical positions of phosphopeptides 1 and 2 (p1 and p2, respectively). Mutations M1 to M3 generated in the S/T-rich region (S/TRR) of p1 are also shown. Mutant M4 was generated by combining mutations M3 and S63 to A (S63A). (B) 293T cells were transfected with either CMV2-FlagIk-1 (wild type [WT]) or the mutants FlagIk-1-M3 (S385, S387, S389, S393 and T394 to A) and FlagIk-1-M4 (S63, S385, S387, S389, S393, and T394 to A) and grown in the presence of radioactive orthophosphate for 16 h. Cells were then harvested, and Ikaros proteins were immunoprecipitated, separated by SDS-PAGE, and transferred to nitrocellulose. Their phosphorylation level was revealed by autoradiography (32P), and the protein level was detected by Western blotting with anti-Flag antibodies (IB:Ik). The phosphopeptide mappings of the following proteins are shown: wild type (WT), S/T of p1 to A (M3) and S63 of p2, and S/T of p1 to A (M4). Three major phosphopeptides (p1, p2, and p3) were detected.
FIG. 3.
FIG. 3.
Ikaros is a substrate of CKII: in vivo and in vitro studies. (A) Graphical representation of kinase consensus sites in p1 and p2. (B) FlagIk1-expressing 293T cells were treated with 20 μM apigenin, 5 μM emodin, and 50 μM DRB (Ap.+DRB) to inhibit CKII (4, 37); 50 μM roscovitine and 50 μM olomoucine (Rosc.+olo) to inhibit cdks; 10 mM LiCl to inhibit GSK3; or all of the drugs together (All). Phosphopeptide mappings of trypsinized Ikaros from the “Cont.,” “Ap.+DRB,” and “All” samples were performed as described in the legends to Fig. 1 and 2. (C) 239T cells expressing FlagIk-1 were treated with vehicle (dimethyl sulfoxide control [Cont.]), 40 μM apigenin plus 10 μM emodin (Apig.), 50 μM DRB, 10 μM H-89 to inhibit PKA, 10 μM KN-62 to inhibit CaMKII, or 10 μM BSMI to inhibit PKC. Proteins were separated by SDS-PAGE, transferred to nitrocellulose membranes, and exposed to reveal phosphate incorporation (32P). Ikaros protein levels were determined by immunoblotting with anti-Flag antibodies (IB:Ik). (D) Purified FlagIk1 (wild type) and the mutant variants FlagIk-1-S63A (S63A), FlagIk-1-M3, or FlagIk-1-M4 proteins were incubated in vitro with recombinant CKII. Phosphopeptide mappings of trypsinized Ikaros proteins were performed like in panel B. The major phosphopeptides (p1, p2, and p3) are shown in panels B and D.
FIG. 4.
FIG. 4.
Ikaros phosphorylation is dynamically regulated during the cell cycle. (A) 293T cells were transfected with CMV2-FlagIk-1. Thirty-six hours after transfection, cells were incubated for an additional 20 h with or without 0.2 mM mimosine (Mimos., late G1-phase arrest), 1 mM hydroxyurea (Hydrox., S-phase arrest), or 0.5-μg/ml nocodazole (Nocod., M-phase arrest). A fraction of cells were stained with PI and analyzed for their cell cycle profiles by flow cytometry (upper). The rest of the cells were treated in the presence of radioactive orthophosphate and subjected to immunoprecipitation for Ikaros proteins. Proteins were separated by SDS-PAGE and then transferred to nitrocellulose membranes, which were exposed to reveal phosphate incorporation (32P, middle). Ikaros protein levels were determined by immunoblotting with anti-Ikaros antibodies (IB:Ik, middle). Phosphopeptide mappings are shown (lower). (B) Cells of the 510 line were treated for 14 h with or without the indicated drugs in the presence of radioactive orthophosphate. Immunoblot analysis and radioactive signal detection were performed as in the middle section of panel A. (C) Primary T lymphocytes were isolated from spleen and mesenteric lymph nodes from 4- to 6-week-old mice. T cells were activated with plate-bound anti-CD3 plus CD28 antibody for the indicated times, and radioactive orthophosphate was added 2 h before harvesting. Analysis of Ikaros proteins was performed as in panel B. Cell cycle profiles and the percentage of cells in S phase are shown (upper). The positions of the Ikaros isoforms 1, 2, and 7 (Ik-1, -2, and -7, respectively) are indicated. Async., asynchronously growing population.
FIG. 5.
FIG. 5.
Ikaros arrests cells in the G1 phase of the cell cycle, and phosphorylation alleviates this effect. (A) Flow cytometric cell cycle profiles of NIH 3T3 cells infected with pMX-GFP-IRES (GFP), pMX-Ik-1-GFP-IRES (Ik-1 GFP), or pMX-Ik-2-GFP-IRES (Ik-2 GFP). Cells were left untreated (asynchronous [ASYNCHRO.], right column) or treated with 1 mM hydroxyurea (HYDROX., middle column) or 0.5-μg/ml nocodazole (NOCOD., left column) to arrest cells in the S or M phase, respectively. The percentage of cells in the G0-G1 (G1), S, or G2/M (M) phases under the different conditions is depicted in the table at the bottom of the panel. Photomicrographs of representative asynchronously growing cells, infected under each condition, are shown. (B) NIH 3T3 cells were infected with Ik-2 retroviruses at 1:5 or 1:2 dilutions in fresh medium. Seventy-two hours after infection, GFP-positive cells were sorted and treated with nocodazole for an additional 16 h. The percentages of cells remaining in the G1 or S + M phases are represented. The level of expressed Ik-2 protein was determined by immunoblotting with anti-Ikaros antibody (IB:Ik). The YY1 protein level is shown as a loading control. The GFP mean fluorescence is shown in parentheses. (C) NIH 3T3 cells were infected with the indicated retroviruses, and 72 h after infection, cells were treated as in panel B. Results from two representative experiments out of six performed with similar results are shown. (D) NIH 3T3 cells were infected with the indicated retroviruses. Seventy-two hours after infection, cells were treated as in panel B. Results from one representative experiment out of three performed with similar results are displayed.
FIG. 6.
FIG. 6.
Ikaros phosphorylation affects DNA binding activity. (A) 293T epithelial cells were transfected with CMV2-FlagIk-1, and nuclear extracts were prepared. After immunoprecipitation, half of Ikaros was dephosphorylated with λ PPase in the immunoprecipitation beads. After removal of the λ PPase by extensive washing, Ikaros was eluted from the beads and assayed for DNA binding. Supershifts were performed by using anti-Ikaros antibody (α-Ikaros) or Ig. (B) Gel shift analysis of indicated Ikaros mutants prepared from 293T cells. The expression levels of Ikaros proteins were analyzed by immunoblotting (IB:Ik). The arrow indicates the specific Ikaros-DNA complex. The asterisk indicates an Ikaros-DNA supershifted complex.
FIG. 7.
FIG. 7.
Models for Ikaros regulation of the G1-S transition. (A) Ikaros is present in a dephosphorylated state during the late G1 phase. In this state, Ikaros is active in DNA binding and restricts the G1-S transition, possibly by regulating transcription of cell cycle regulators (*, in either a positive or negative manner). Phosphorylation by CKII and maybe other kinases in the S/T-rich region in exon 8 reduces Ikaros binding to DNA to facilitate progression through the S phase of the cell cycle. (B) Mutations in the Ikaros DNA binding domain prevent Ikaros from exerting control over the G1-S transition (by disabling association with the regulatory regions of cell cycle regulators) and cause hyperproliferation and the rapid development of leukemia. (C) Mutations of the phosphate acceptors in exon 8 increase Ikaros DNA binding activity and its ability to impede the G1-S transition.

Similar articles

Cited by

References

    1. Allman, D., A. Sambandam, S. Kim, J. P. Miller, A. Pagan, D. Well, A. Meraz, and A. Bhandoola. 2003. Thymopoiesis independent of common lymphoid progenitors. Nat. Immunol. 4:168-174. - PubMed
    1. Avitahl, N., S. Winandy, C. Friedrich, B. Jones, Y. Ge, and K. Georgopoulos. 1999. Ikaros sets thresholds for T cell activation and regulates chromosome propagation. Immunity 10:333-343. - PubMed
    1. Boyle, W. J., P. van der Geer, and T. Hunter. 1991. Phosphopeptide mapping and phosphoamino acid analysis by two-dimensional separation on thin-layer cellulose plates. Methods Enzymol. 201:110-149. - PubMed
    1. Channavajhala, P., and D. C. Seldin. 2002. Functional interaction of protein kinase CK2 and c-Myc in lymphomagenesis. Oncogene 21:5280-5288. - PubMed
    1. Classon, M., and E. Harlow. 2002. The retinoblastoma tumour suppressor in development and cancer. Nat. Rev. Cancer 2:910-917. - PubMed

Publication types