. 2004 Apr;24(7):2842-52.
doi: 10.1128/MCB.24.7.2842-2852.2004.

Normal human fibroblasts are resistant to RAS-induced senescence

Affiliations

Normal human fibroblasts are resistant to RAS-induced senescence

Jennifer A Benanti et al. Mol Cell Biol. 2004 Apr.

Abstract

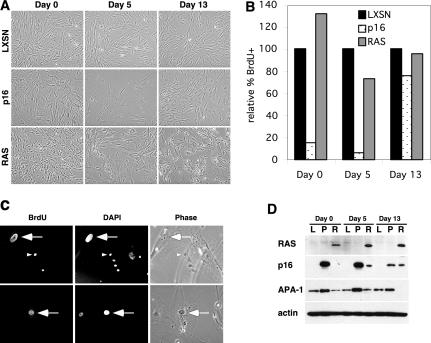
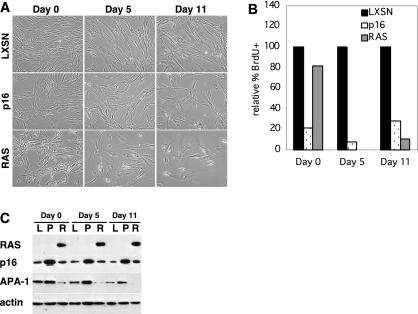
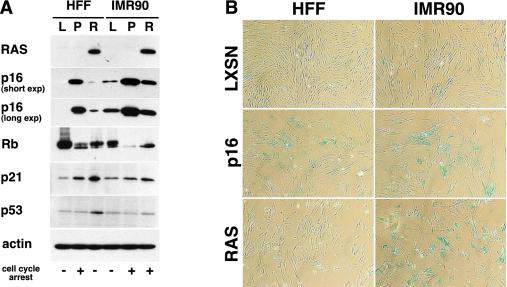
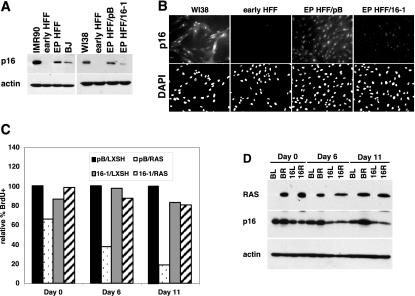
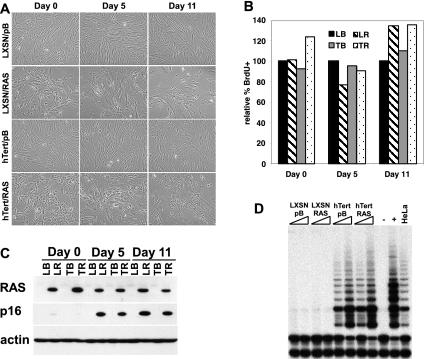
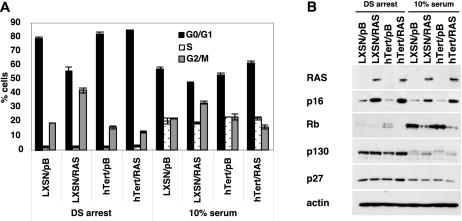
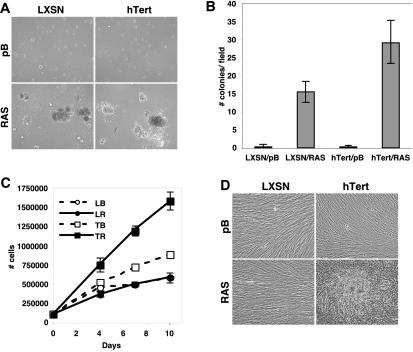
Oncogenic stimuli are thought to induce senescence in normal cells in order to protect against transformation and to induce proliferation in cells with altered p53 and/or retinoblastoma (Rb) pathways. In human fibroblasts, RAS initiates senescence through upregulation of the cyclin-dependent kinase inhibitor p16INK4A. We show here that in contrast to cultured fibroblast strains, freshly isolated normal fibroblasts are resistant to RAS-induced senescence and instead show some characteristics of transformation. RAS did not induce growth arrest or expression of senescence-associated beta-galactosidase, and Rb remained hyperphosphorylated despite elevated levels of p16. Instead, RAS promoted anchorage-independent growth of normal fibroblasts, although expression of hTert with RAS increased colony formation and allowed normal fibroblasts to bypass contact inhibition. To test the hypothesis that p16 levels determine how cells respond to RAS, we expressed RAS in freshly isolated fibroblasts that expressed very low levels of p16, in hTert-immortalized fibroblasts that had accumulated intermediate levels of p16, and in IMR90 fibroblasts with high levels of p16. RAS induced growth arrest in cells with higher p16 levels, and this effect was reversed by p16 knockdown in the hTert-immortalized fibroblasts. These findings indicate that culture-imposed stress sensitizes cells to RAS-induced arrest, whereas early passage cells do not arrest in response to RAS.


Figures

FIG. 1.
FIG. 1.
HFFs do not senesce in response to RAS expression. (A) Early passage HFF1 cells were infected with LXSN-, p16-, or RAS-expressing retroviruses. Cells were photographed immediately after selection (day 0) as well as 5 and 13 days later. (B) LXSN cells, p16 cells, and RAS cells from panel A were labeled with BrdU, fixed, stained with anti-BrdU antibody, and counted. The percentages of BrdU-positive cells, relative to those of LXSN controls, are shown. (C) Representative BrdU staining in RAS-expressing HFFs on day 5. As seen in panel A, RAS cultures were a heterogeneous population consisting of large, apparently senescent nuclei (large arrows) and smaller nuclei (small arrowheads). A fraction of both large and small nuclei were BrdU positive. (D) LXSN (L)-, p16 (P)-, and RAS (R)-expressing cells from panel A were harvested on days 0, 5, and 13. Levels of RAS, p16, and APA-1 proteins were examined by Western blot analysis. Actin is shown as a loading control.
FIG. 2.
FIG. 2.
IMR90 cells arrest following RAS expression. (A) IMR90 cells were infected with LXSN-, p16-, or RAS-expressing retroviruses. Cells were photographed immediately after selection (day 0) as well as 5 and 11 days later. (B) LXSN cells, p16 cells, and RAS cells from panel A were labeled with BrdU, fixed, stained with anti-BrdU antibody, and counted. The percentages of BrdU-positive cells, relative to those of LXSN controls, are shown. (C) LXSN (L)-, p16 (P)-, and RAS (R)-expressing cells from panel A were harvested on days 0, 5, and 13. Levels of RAS, p16, and APA-1 proteins were examined by Western blot analysis. Actin is shown as a loading control.
FIG. 3.
FIG. 3.
Comparison of HFF1 and IMR90 cells 5 days after selection. (A) Shown are Western blots of lysates from LXSN (L)-, p16 (P)-, and RAS (R)-expressing HFF1 and IMR90 cells harvested 5 days after selection. Blots were probed with antibodies to RAS, p16 (short and long exposures are shown), Rb, p21, p53, and actin. The corresponding cell cycle arrest is indicated beneath the blots. (B) HFF1 and IMR90 fibroblasts infected with LXSN, p16, or RAS were fixed 5 days after selection and stained for SA-β-Gal expression. Representative fields are shown.
FIG. 4.
FIG. 4.
Expression of RAS in extended-passage, hTert-immortalized HFFs. (A) Western blot of p16 protein in IMR90 fibroblasts, early passage HFFs (early HFF), hTert-immortalized HFFs at 195 population doublings after selection (EP HFF), BJ fibroblasts, WI38 fibroblasts, and extended-passage HFFs transduced with empty vector (EP HFF/pB) or a short hairpin RNA-targeting p16 (EP HFF/16-1). Actin is shown as a loading control. (B) p16 immunofluorescence in WI38 fibroblasts, early passage HFFs (early HFF), and extended-passage HFFs expressing a control vector (EP HFF/pB) or p16 short hairpin RNA (EP HFF/16-1). Nuclei were visualized by corresponding DAPI staining. Overall p16 protein levels from cells at the identical passages are shown in panel A. (C) pB/LXSH, pB/RAS, 16-1/LXSH, and 16-1/RAS cells were labeled with BrdU, fixed, stained with anti-BrdU antibody, and counted. The percentages of BrdU-positive cells, relative to those of LXSN controls, are shown. (D) pB/LXSH (BL), pB/RAS (BR), 16-1/LXSH (16L), and 16-1/RAS (16R) cells from panel C were analyzed by Western blotting on days 0, 6, and 11. Levels of RAS, p16, and actin are shown.
FIG. 5.
FIG. 5.
Expression of RAS in early passage HFF2 cells. (A) Early passage HFF2 fibroblasts expressing LXSN or hTert were infected with retroviruses expressing pB empty vector or pB/RAS. Cells were photographed immediately after selection (day 0) as well as 5 and 11 days later. (B) LXSN/pB (LB), LXSN/RAS (LR), hTert/pB (TB), and hTert/RAS (TR) cells from panel A were labeled with BrdU, fixed, stained with anti-BrdU antibody, and counted. The percentages of BrdU-positive cells, relative to those of LXSN controls, are shown. (C) RAS, p16, and actin protein levels were examined in cells described in panel A on days 0, 5, and 11, as indicated. (D) Telomerase activity in cells from panel A was analyzed 14 days after selection by using the TRAPeze kit. For each cell population, 0.2 and 2 μg of protein lysate was analyzed and compared to a buffer-alone control (−), the positive control provided with the kit (+), and 0.1 μg of HeLa extract.
FIG. 6.
FIG. 6.
Quiescence in RAS-expressing HFFs. (A) Triplicate plates of the cells described in the legend of Fig. 5 were arrested by density and serum starvation as described in the text, labeled with BrdU, and fixed for cell cycle analysis (DS arrest). A second set of plates was stimulated to reenter the cell cycle by the addition of 10% serum and was then harvested 24 h later (10% serum). The percentages of cells in corresponding phases of the cell cycle are indicated; G0/G1 cells have a 2N DNA content, BrdU-positive cells are in S phase, and cells in the G2/M phase have a 4N DNA content. (B) An additional set of plates from panel A was harvested and analyzed by Western blotting for RAS, p16, Rb, p130, p27, and actin.
FIG. 7.
FIG. 7.
In vitro transformation of RAS-expressing HFFs. (A) Cells described in Fig. 5 were seeded into soft agar at a concentration of 50,000 cells/well and fed every 4 days. Cells were photographed after 21 days. (B) Quantitation of colonies from panel A. Colonies in three representative fields per well were counted for LXSN/pB (LB), LXSN/RAS (LR), hTert/pB (TB), and hTert/RAS (TR) cells, and the results were averaged. Average values from triplicate wells are represented in the graph. (C) Cells from Fig. 5 were plated in six-well dishes at a concentration of 100,000 cells per well and fed every 3 days. Triplicate wells were counted on days 4, 7, and 10 after plating. Average cell numbers are indicated for LB, LR, TB, and TR cells. (D) Photomicrographs of cells from panel C on day 13 after plating. LB, LR, and TB cells all appeared to be monolayers, while TR cells grew in multiple layers.

References

    1. Adams, J. M., and S. Cory. 1991. Transgenic models of tumor development. Science 254:1161-1167. - PubMed
    1. Bartz, S. R., and M. A. Vodicka. 1997. Production of high-titer human immunodeficiency virus type 1 pseudotyped with vesicular stomatitis virus glycoprotein. Methods 12:337-342. - PubMed
    1. Benanti, J. A., D. K. Williams, K. L. Robinson, H. L. Ozer, and D. A. Galloway. 2002. Induction of extracellular matrix-remodeling genes by the senescence-associated protein APA-1. Mol. Cell. Biol. 22:7385-7397. - PMC - PubMed
    1. Bos, J. L. 1989. ras oncogenes in human cancer: a review. Cancer Res. 49:4682-4689. - PubMed
    1. Brookes, S., J. Rowe, M. Ruas, S. Llanos, P. A. Clark, M. Lomax, M. C. James, R. Vatcheva, S. Bates, K. H. Vousden, D. Parry, N. Gruis, N. Smit, W. Bergman, and G. Peters. 2002. INK4a-deficient human diploid fibroblasts are resistant to RAS-induced senescence. EMBO J. 21:2936-2945. - PMC - PubMed

Publication types