

Assessing the probability that a positive report is false: an approach for molecular epidemiology studies
- PMID: 15026468
- PMCID: PMC7713993
- DOI: 10.1093/jnci/djh075
Assessing the probability that a positive report is false: an approach for molecular epidemiology studies
Abstract
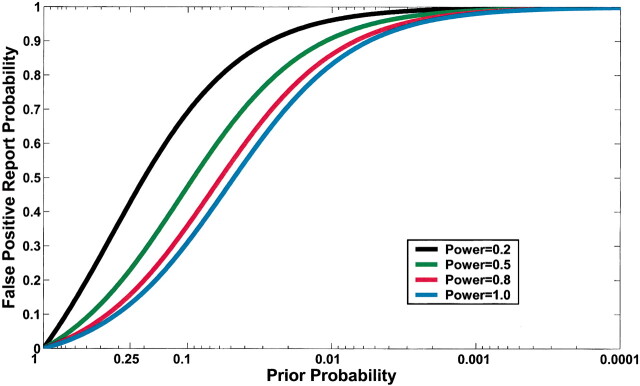
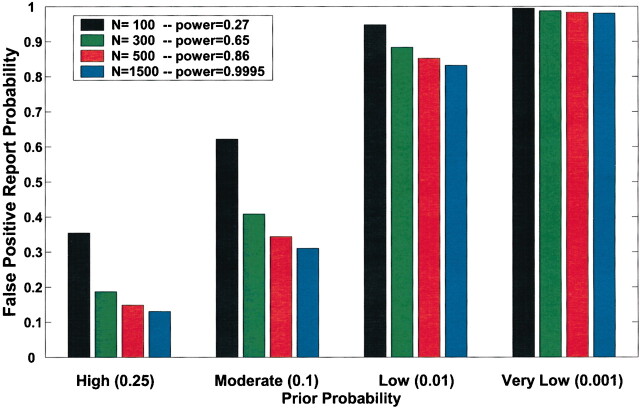
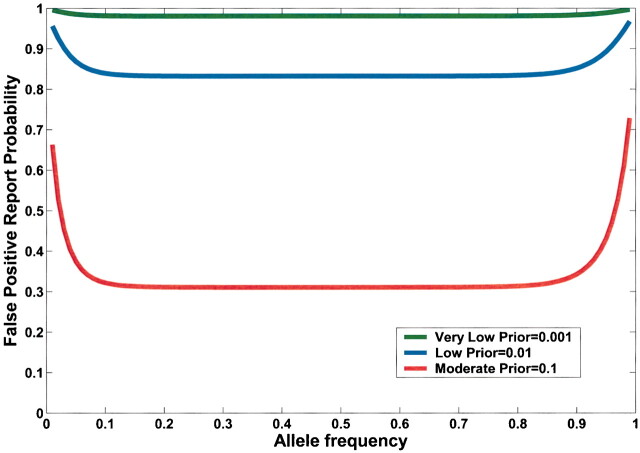
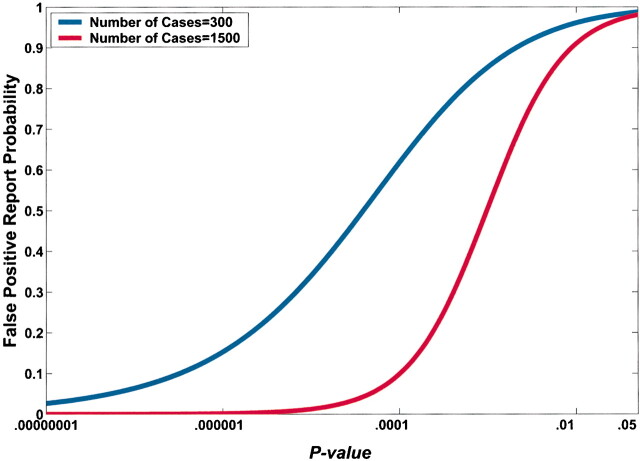
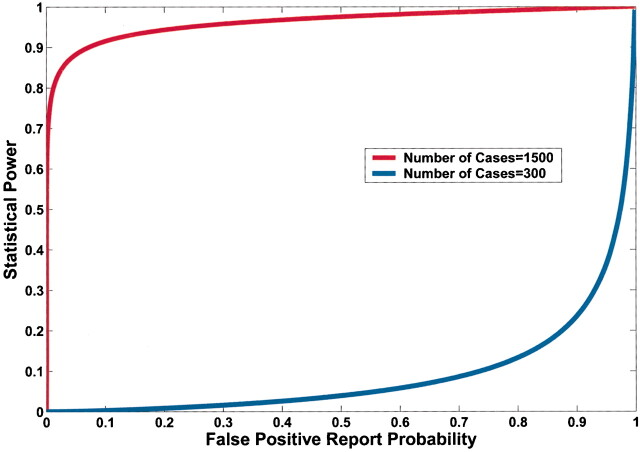
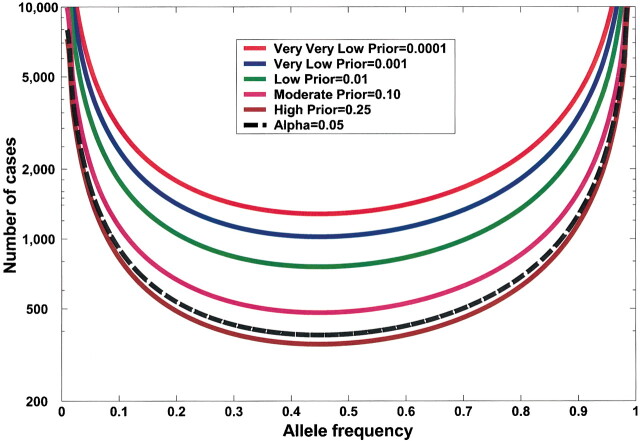
Too many reports of associations between genetic variants and common cancer sites and other complex diseases are false positives. A major reason for this unfortunate situation is the strategy of declaring statistical significance based on a P value alone, particularly, any P value below.05. The false positive report probability (FPRP), the probability of no true association between a genetic variant and disease given a statistically significant finding, depends not only on the observed P value but also on both the prior probability that the association between the genetic variant and the disease is real and the statistical power of the test. In this commentary, we show how to assess the FPRP and how to use it to decide whether a finding is deserving of attention or "noteworthy." We show how this approach can lead to improvements in the design, analysis, and interpretation of molecular epidemiology studies. Our proposal can help investigators, editors, and readers of research articles to protect themselves from overinterpreting statistically significant findings that are not likely to signify a true association. An FPRP-based criterion for deciding whether to call a finding noteworthy formalizes the process already used informally by investigators--that is, tempering enthusiasm for remarkable study findings with considerations of plausibility.
Figures
Comment in
-
Betting odds and genetic associations.J Natl Cancer Inst. 2004 Mar 17;96(6):421-3. doi: 10.1093/jnci/djh094. J Natl Cancer Inst. 2004. PMID: 15026459 Review. No abstract available.
-
Re: Assessing the probability that a positive report is false: an approach for molecular epidemiology studies.J Natl Cancer Inst. 2004 Nov 17;96(22):1722; author reply 1722-3. doi: 10.1093/jnci/djh326. J Natl Cancer Inst. 2004. PMID: 15547186 No abstract available.
-
Gene-environment interactions: how many false positives?J Natl Cancer Inst. 2005 Apr 20;97(8):550-1. doi: 10.1093/jnci/dji122. J Natl Cancer Inst. 2005. PMID: 15840871 No abstract available.
References
-
- Freely associating. Nat Genet 1999; 22: 1–2. - PubMed
-
- Ioannidis JP, Ntzani EE, Trikalinos TA, Contopoulos-Ioannidis DG. Replication validity of genetic association studies. Nat Genet 2001; 29: 306–9. - PubMed
-
- Hirschhorn JN, Lohmueller K, Byrne E, Hirschhorn K. A comprehensive review of genetic association studies. Genet Med 2002; 4: 45–61. - PubMed
-
- Thomas DC, Witte JS. Point: population stratification: a problem for case-control studies of candidate-gene associations? Cancer Epidemiol Biomarkers Prev 2002; 11: 505–12. - PubMed
MeSH terms
LinkOut - more resources
Full Text Sources
Other Literature Sources
Miscellaneous
