

Role of lipid-mobilising factor (LMF) in protecting tumour cells from oxidative damage
- PMID: 15026812
- PMCID: PMC2409641
- DOI: 10.1038/sj.bjc.6601669
Role of lipid-mobilising factor (LMF) in protecting tumour cells from oxidative damage
Abstract
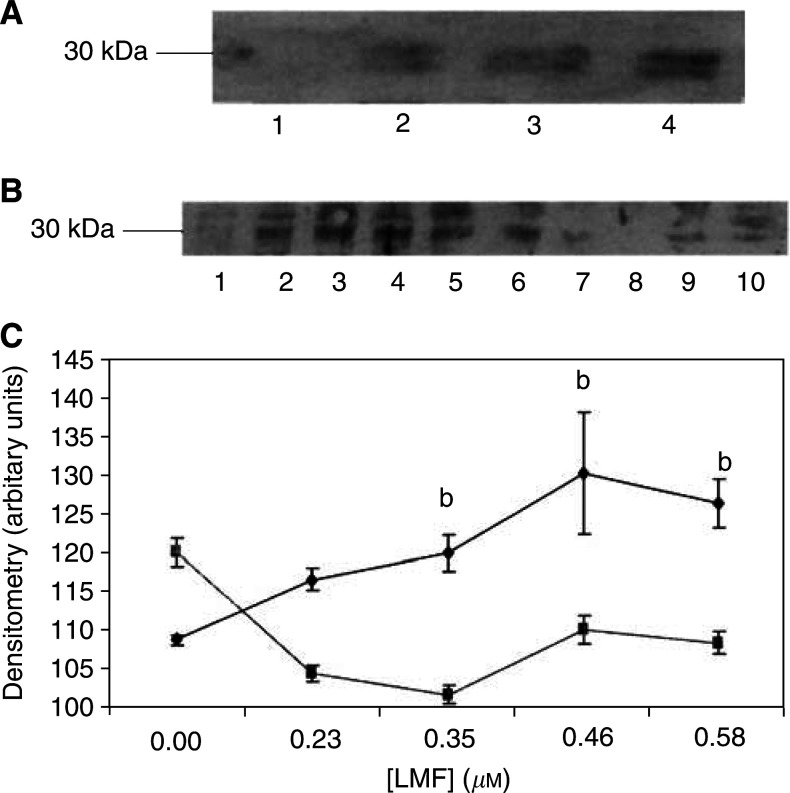
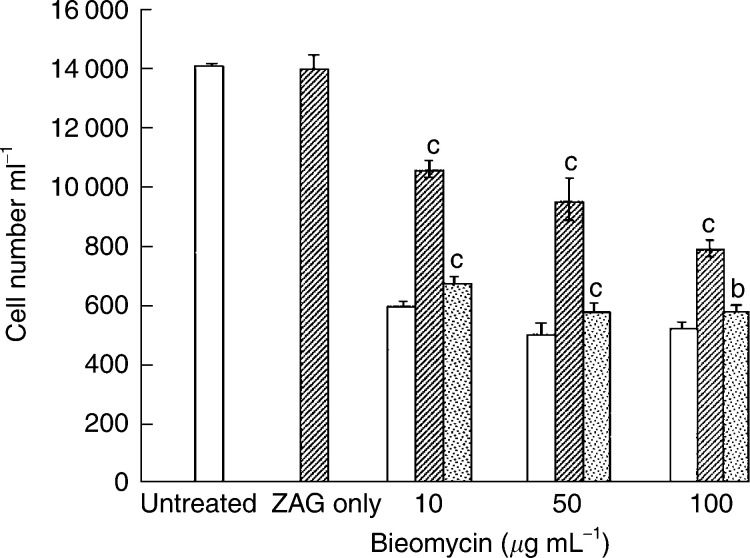
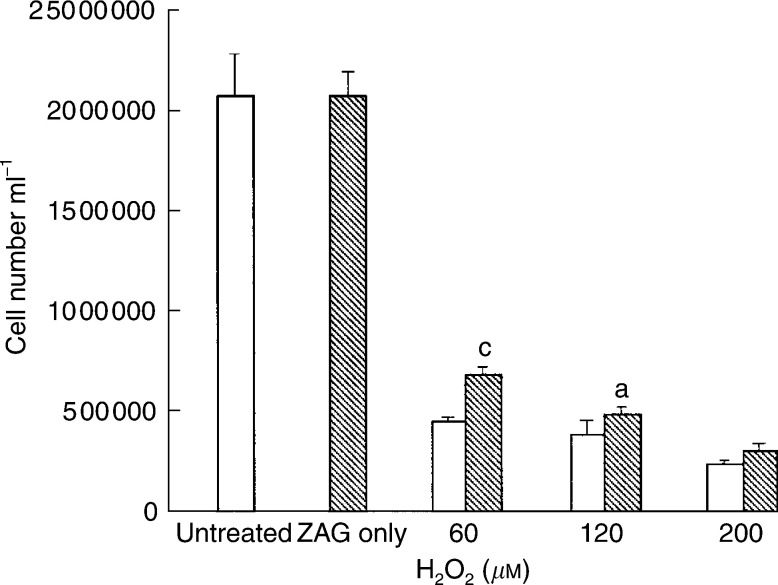
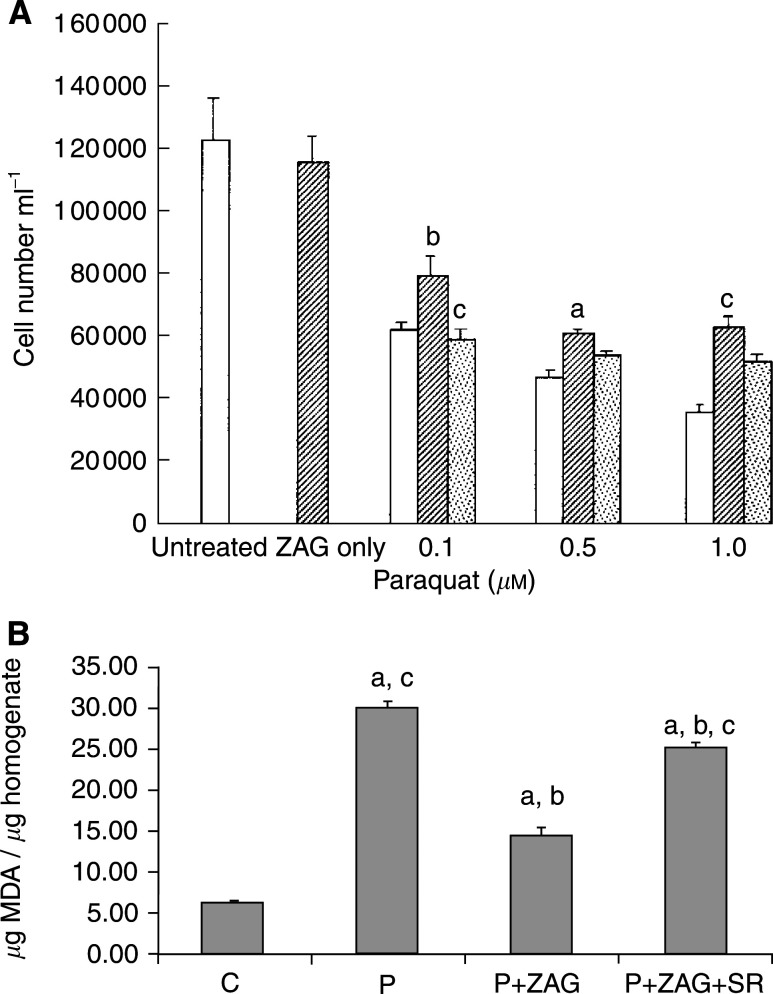
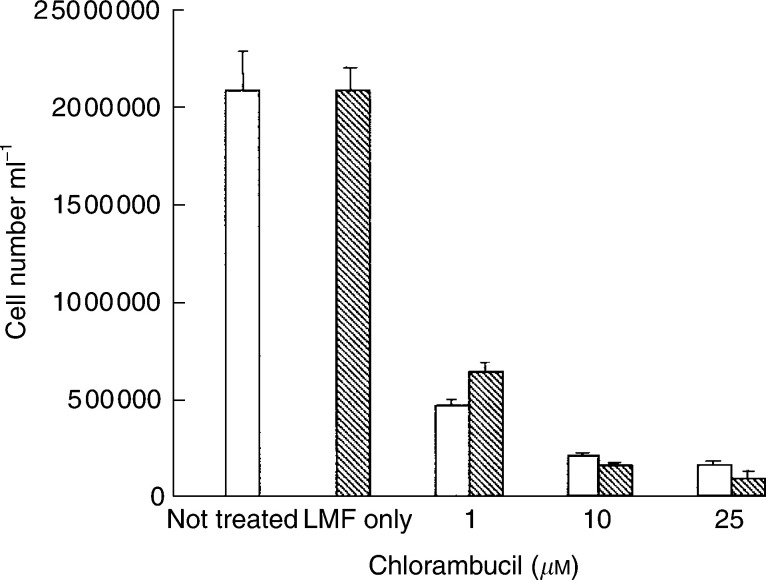
Lipid-mobilising factor (LMF) is produced by cachexia-inducing tumours and is involved in the degradation of adipose tissue, with increased oxidation of the released fatty acids through an induction of uncoupling protein (UCP) expression. Since UCP-2 is thought to be involved in the detoxification of free radicals if LMF induced UCP-2 expression in tumour cells, it might attenuate free radical toxicity. As a model system we have used MAC13 tumour cells, which do not produce LMF. Addition of LMF caused a concentration-dependent increase in UCP-2 expression, as determined by immunoblotting. This effect was attenuated by the beta3 antagonist SR59230A, suggesting that it was mediated through a beta3 adrenoreceptor. Co-incubation of LMF with MAC13 cells reduced the growth-inhibitory effects of bleomycin, paraquat and hydrogen peroxide, known to be free radical generators, but not chlorambucil, an alkylating agent. There was no effect of LMF alone on cellular proliferation. These results indicate that LMF antagonises the antiproliferative effect of agents working through a free radical mechanism, and may partly explain the unresponsiveness to the chemotherapy of cachexia-inducing tumours.
Figures
Similar articles
-
Effect of zinc-alpha2-glycoprotein (ZAG) on expression of uncoupling proteins in skeletal muscle and adipose tissue.Cancer Lett. 2004 Aug 20;212(1):71-81. doi: 10.1016/j.canlet.2004.03.021. Cancer Lett. 2004. PMID: 15246563
-
Modulation of adipocyte G-protein expression in cancer cachexia by a lipid-mobilizing factor (LMF).Br J Cancer. 2001 Sep 1;85(5):758-63. doi: 10.1054/bjoc.2001.1992. Br J Cancer. 2001. PMID: 11531264 Free PMC article.
-
Induction of lipolysis in vitro and loss of body fat in vivo by zinc-alpha2-glycoprotein.Biochim Biophys Acta. 2004 Feb 27;1636(1):59-68. doi: 10.1016/j.bbalip.2003.12.004. Biochim Biophys Acta. 2004. PMID: 14984739
-
Uncoupling proteins: their roles in adaptive thermogenesis and substrate metabolism reconsidered.Br J Nutr. 2001 Aug;86(2):123-39. doi: 10.1079/bjn2001412. Br J Nutr. 2001. PMID: 11502224 Review.
-
Cancer cachexia.Langenbecks Arch Surg. 2004 Aug;389(4):299-305. doi: 10.1007/s00423-004-0486-7. Epub 2004 May 28. Langenbecks Arch Surg. 2004. PMID: 15168125 Review.
Cited by
-
1-Sarcosine-angiotensin II infusion effects on food intake, weight loss, energy expenditure, and skeletal muscle UCP3 gene expression in a rat model.J Cachexia Sarcopenia Muscle. 2014 Sep;5(3):239-46. doi: 10.1007/s13539-014-0133-2. Epub 2014 Mar 11. J Cachexia Sarcopenia Muscle. 2014. PMID: 24614996 Free PMC article.
-
Unveiling the Role of the Proton Gateway, Uncoupling Proteins (UCPs), in Cancer Cachexia.Cancers (Basel). 2023 Feb 23;15(5):1407. doi: 10.3390/cancers15051407. Cancers (Basel). 2023. PMID: 36900198 Free PMC article. Review.
-
Clinical Implications of Malnutrition in the Management of Patients with Pancreatic Cancer: Introducing the Concept of the Nutritional Oncology Board.Nutrients. 2021 Oct 7;13(10):3522. doi: 10.3390/nu13103522. Nutrients. 2021. PMID: 34684523 Free PMC article. Review.
-
Pancreatic Cancer and Cachexia-Metabolic Mechanisms and Novel Insights.Nutrients. 2020 May 26;12(6):1543. doi: 10.3390/nu12061543. Nutrients. 2020. PMID: 32466362 Free PMC article. Review.
-
Understanding tumor anabolism and patient catabolism in cancer-associated cachexia.Am J Cancer Res. 2017 May 1;7(5):1107-1135. eCollection 2017. Am J Cancer Res. 2017. PMID: 28560061 Free PMC article.
References
-
- Armstrong MB, Towle HC (2001) Polyunsaturated fatty acids stimulate hepatic UCP-2 expression via a PPARα-mediated pathway. Am J Physiol Endocrinol Metab 281: E1197–E1204 - PubMed
-
- Andreyev HJN, Norman AR, Oates J, Cunningham D (1998) Why do patients with weight loss have a worse outcome when undergoing chemotherapy for gastrointestinal malignancies? Eur J Cancer 34: 503–509 - PubMed
-
- Bürgi W, Schmid K (1961) Preparation and properties of Zn-α2-glycoprotein of normal human plasma. J Biol Chem 236: 1066–1074 - PubMed
-
- Cadenas S, Buckingham JA, Samec S, Seydoux J, Din N, Dulloo AG, Brand MD (1999) UCP2 and UCP3 rise in starved rat skeletal muscle but mitochondrial proton conductance is unchanged. FEBS Lett 462: 257–260 - PubMed
MeSH terms
Substances
LinkOut - more resources
Full Text Sources
Other Literature Sources
Research Materials
