Non-functional immunoglobulin G transcripts in a case of hyper-immunoglobulin M syndrome similar to type 4
- PMID: 15027907
- PMCID: PMC1782402
- DOI: 10.1111/j.0019-2805.2003.01790.x
Non-functional immunoglobulin G transcripts in a case of hyper-immunoglobulin M syndrome similar to type 4
Abstract
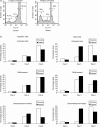
Summary 86% of immunoglobulin G (IgG) heavy-chain gene transcripts were found to be non-functional in the peripheral blood B cells of a patient initially diagnosed with common variable immunodeficiency, who later developed raised IgM, whereas no non-functionally rearranged transcripts were found in the cells of seven healthy control subjects. All the patient's IgM heavy-chain and kappa light-chain transcripts were functional, suggesting that either non-functional rearrangements were being selectively class-switched to IgG, or that receptor editing was rendering genes non-functional after class-switching. The functional gamma-chain sequences showed a normal rate of somatic hypermutation while non-functional sequences contained few somatic mutations, suggesting that most came from cells that had no functional gene and therefore were not receiving signals for hypermutation. However, apoptosis of peripheral blood lymphocytes was not impaired. No defects have been found in any of the genes currently known to be responsible for hyper-IgM syndrome but the phenotype fits best to type 4.
Figures


 = VH,
= VH,  = D,
= D,  = JH (stripes indicate correct frame, gaps indicate actual frame reading through from VH– thus the above example is out of frame), and unhighlighted letters = junctional bases.
 = VH,
= VH,  = D,
= D,  = JH (stripes indicate correct frame, gaps indicate actual frame reading through from VH– thus the above example is out of frame), and unhighlighted letters = junctional bases.


Similar articles
-
Human CD19 and CD40L deficiencies impair antibody selection and differentially affect somatic hypermutation.J Allergy Clin Immunol. 2014 Jul;134(1):135-44. doi: 10.1016/j.jaci.2013.11.015. Epub 2014 Jan 11. J Allergy Clin Immunol. 2014. PMID: 24418477
-
Evidence that in X-linked immunodeficiency with hyperimmunoglobulinemia M the intrinsic immunoglobulin heavy chain class switch mechanism is intact.Eur J Immunol. 1990 Dec;20(12):2603-8. doi: 10.1002/eji.1830201212. Eur J Immunol. 1990. PMID: 1980111
-
Long-term study of a female hyper-IgM immunodeficiency.Exp Clin Immunogenet. 2000;17(4):173-8. doi: 10.1159/000019136. Exp Clin Immunogenet. 2000. PMID: 11096255
-
Hyper-immunoglobulin-M syndromes caused by an intrinsic B cell defect.Curr Opin Allergy Clin Immunol. 2003 Dec;3(6):421-5. doi: 10.1097/00130832-200312000-00002. Curr Opin Allergy Clin Immunol. 2003. PMID: 14612665 Review.
-
Defects of class-switch recombination.J Allergy Clin Immunol. 2006 Apr;117(4):855-64. doi: 10.1016/j.jaci.2006.01.043. J Allergy Clin Immunol. 2006. PMID: 16630945 Review.
Cited by
-
Biased immunoglobulin G (IgG) subclass production in a case of hyper-IgM syndrome.Clin Diagn Lab Immunol. 2004 Nov;11(6):1192-3. doi: 10.1128/CDLI.11.6.1192-1193.2004. Clin Diagn Lab Immunol. 2004. PMID: 15539528 Free PMC article.
-
Analysis of expressed and non-expressed IGK locus rearrangements in chronic lymphocytic leukemia.Mol Med. 2005 Jan-Dec;11(1-12):52-8. doi: 10.2119/2005-00044.Belessi. Mol Med. 2005. PMID: 16622520 Free PMC article.
References
-
- Spickett GP, Farrant J, North ME, Zhang JG, Morgan L, Webster AD. Common variable immunodeficiency: how many diseases? Immunol Today. 1997;18:325–8. - PubMed
-
- WHO Scientific Group. Primary immunodeficiency diseases. Report of a WHO Scientific Group. Clin Exp Immunol. 1997;109(Suppl. 1):1–28. - PubMed
-
- Conley ME, Notarangelo LD, Etzioni A. Diagnostic criteria for primary immunodeficiencies. Representing PAGID (Pan-American Group for Immunodeficiency) and ESID (European Society for Immunodeficiencies) Clin Immunol. 1999;93:190–7. - PubMed
-
- Webster ADB. Common variable immunodeficiency. Immunol Allergy Clin N Am. 2001;21:1–22.
-
- Cunningham-Rundles C, Bodian C. Common variable immunodeficiency. clinical and immunological features of 248 patients. Clin Immunol. 1999;92:34–48. - PubMed
Publication types
MeSH terms
Substances
LinkOut - more resources
Full Text Sources
