. 2004 Apr;186(7):1959-71.
doi: 10.1128/JB.186.7.1959-1971.2004.

Transcriptional analysis of spo0A overexpression in Clostridium acetobutylicum and its effect on the cell's response to butanol stress

Affiliations

Transcriptional analysis of spo0A overexpression in Clostridium acetobutylicum and its effect on the cell's response to butanol stress

Keith V Alsaker et al. J Bacteriol. 2004 Apr.

Abstract

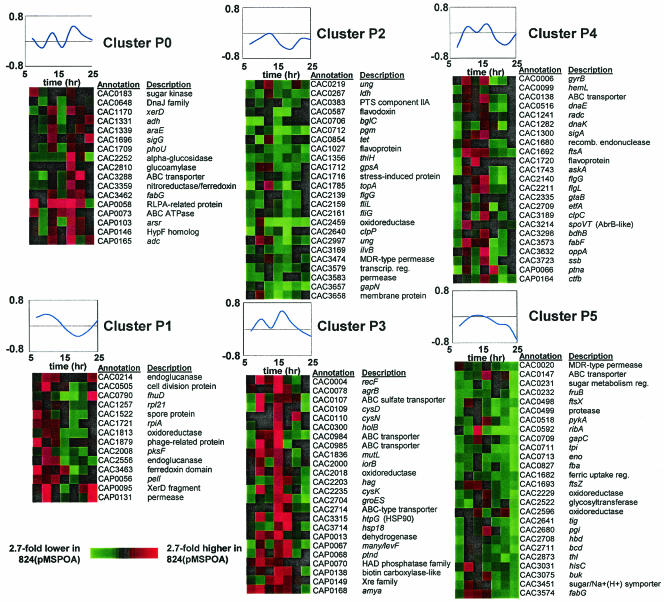
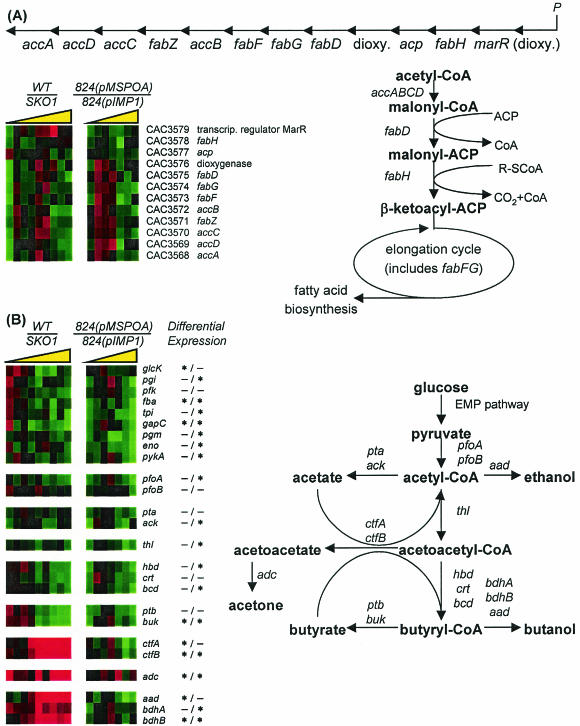
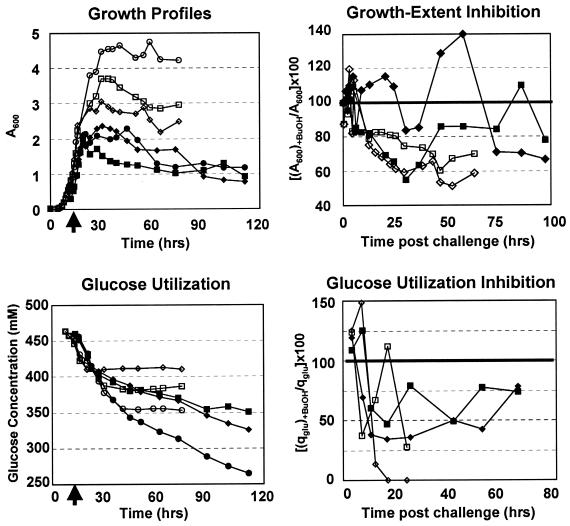
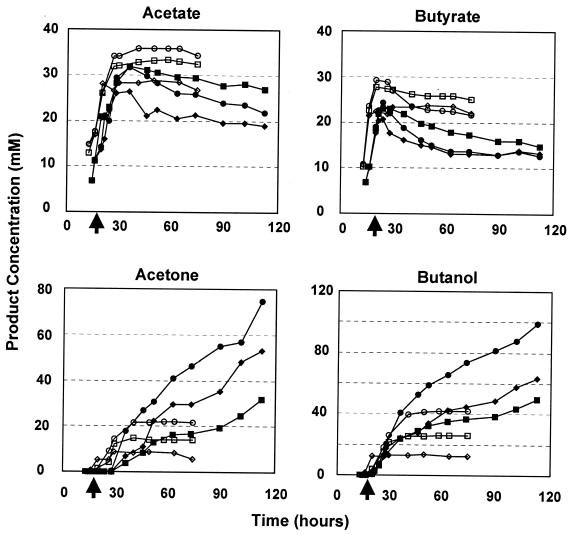
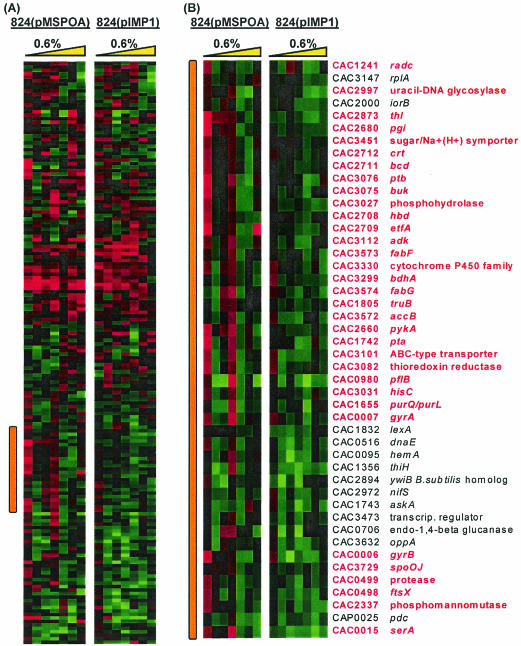
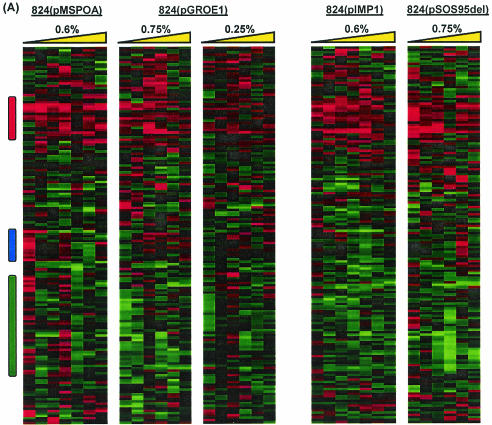
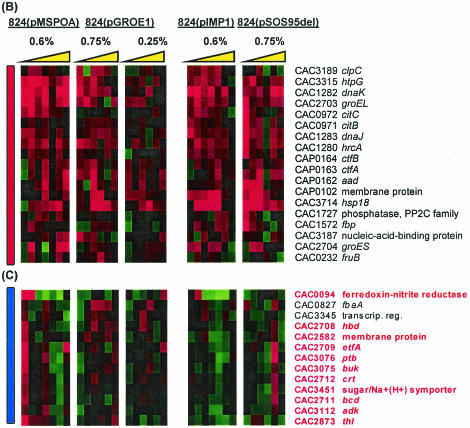
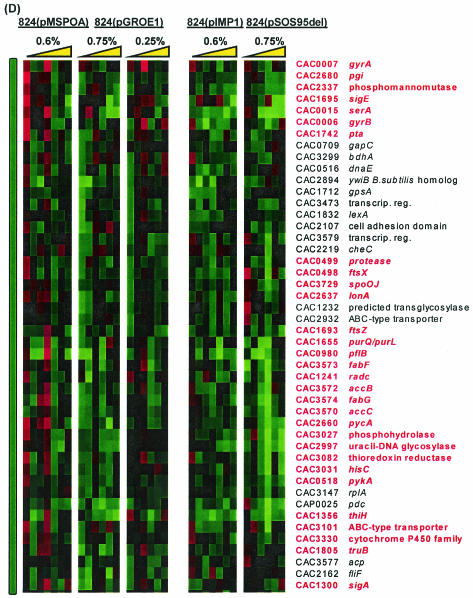
Spo0A is the regulator of stationary-phase events and is required for transcription of solvent formation genes in Clostridium acetobutylicum. In order to elucidate the role of spo0A in differentiation, we performed transcriptional analysis of 824(pMSPOA) (a spo0A-overexpressing C. acetobutylicum strain with enhanced sporulation) against a plasmid control strain. DNA microarray data were contrasted to data from a spo0A knockout strain (SKO1) that neither sporulates nor produces solvents. Transcripts of fatty acid metabolism genes, motility and chemotaxis genes, heat shock protein genes, and genes encoding the Fts family of cell division proteins were differentially expressed in the two strains, suggesting that these genes play roles in sporulation and the solvent stress response. 824(pMSPOA) alone showed significant downregulation of many glycolytic genes in stationary phase, which is consistent with metabolic flux analysis data. Surprisingly, spo0A overexpression resulted in only nominal transcriptional changes of regulatory genes (abrB and sigF) whose expression was significantly altered in SKO1. Overexpression of spo0A imparted increased tolerance and prolonged metabolism in response to butanol stress. While most of the differentially expressed genes appear to be part of a general stress response (similar to patterns in two plasmid control strains and a groESL-overexpressing strain), several genes were expressed at higher levels at early time points after butanol challenge only in 824(pMSPOA). Most of these genes were related to butyryl coenzyme A and butyrate formation and/or assimilation, but they also included the cell division gene ftsX, the gyrase subunit-encoding genes gyrB and gyrA, DNA synthesis and repair genes, and fatty acid synthesis genes, all of which might play a role in the immediate butanol stress response, and thus in enhanced butanol tolerance.


Figures

FIG. 1.
FIG. 1.
Growth profiles for 824(pMSPOA) (solid squares) and 824(pIMP1) (open squares). Capital letters indicate the times at which microarray analyses were performed (this study), and the arrows show the times at which Northern blot analyses were performed previously (13).
FIG. 2.
FIG. 2.
Comparison of ratios between 824(pMSPOA) and 824(pIMP1) spo0A (a) and aad-ctfAB (b) transcripts from microarrays (open circles) (this study) and Northern blot analysis (solid diamonds) (13). Asterisks indicate differential expression with a confidence level of at least 95% at the time point for the microarray data. The aad-ctfAB Northern blots are shown below the plots. Lanes indicate time points: 1 and 2, exponential growth, 3, transitional growth; 4 and 5, early-stationary phase. Total radioactive counts have been reported previously (13), and time points 1, 2, and 5 were treated as having equal (background) counts.
FIG. 3.
FIG. 3.
Expression profiles for all differentially expressed (95% confidence interval) genes; the ratio is 824(pMSPOA)/824(pIMP1). Plots indicate the time course of the average normalized expression ratios within the cluster.
FIG. 4.
FIG. 4.
(A) Structure and comparison of expression profile in a predicted fatty acid synthesis operon (CAC3568 to CAC3579). The gene identified as CAC3580 (annotated as related to 2-nitropropane dioxygenase) was omitted from analysis for missing too many data points. The fatty acid synthesis pathway is based on the work of de Mendoza et al. (8) and the Kyoto Encyclopedia of Genes and Genomes (KEGG; www.genome.ad.jp/kegg/kegg2.html). P, predicted promoter; ACP, acyl carrier protein; R-ScoA, straight- or branched-chain acyl-CoA primer. (B) Structure and comparison of primary metabolism expression profiles in C. acetobutylicum spo0A strains as generated by microarrays. The last column indicates whether differential expression was achieved in each experiment to a 95% confidence interval on at least one array for at least two time points; an asterisk before the slash indicates differential expression in the wild-type (WT)/SKO1 experiment, and an asterisk after the slash indicates differential expression in the 824(pMSPOA)/824(pIMP1) experiment. The colorimetric ratio is on the same scale as in Fig. 3, and the yellow triangle represents the direction of increasing culture time.
FIG. 5.
FIG. 5.
Growth and glucose utilization and inhibition profiles for 824(pMSPOA) (solid symbols) and 824(pIMP1) (open symbols) cultures challenged with butanol. Circles, unchallenged cultures; squares and diamonds, cultures challenged with 0.2 and 0.6% butanol, respectively. Arrows on the x axis indicate time of butanol challenge.
FIG. 6.
FIG. 6.
Product profiles for butanol-challenged cultures of 824(pMSPOA) (solid symbols) and 824(pIMP1) (open symbols). Circles, unchallenged cultures; squares and diamonds, cultures challenged with 0.2 and 0.6% butanol, respectively. Arrows on the x axis indicate time of butanol challenge.
FIG. 7.
FIG. 7.
(A) Expression ratio profiles for all 168 differentially expressed genes in butanol-challenged 824(pMSPOA) and 824(pIMP1) cultures. (B) Detail from panel A (location marked by orange vertical bar) identifying genes that show significant upregulation in 824(pMSPOA) (designations printed in red). Samples were taken at 0.17, 0.5, 1, 2, 6, 12, and 24 h post-butanol stress. Yellow triangle represents the direction of increasing time following butanol stress.
FIG. 8.
FIG. 8.
(A) Comparison of differential expression of genes due to butanol challenge in five experiments. Colored vertical bars indicate regions of interest shown in detail in panels with corresponding bars. (B through D) Detailed views of genes that were universally upregulated (B) (red), upregulated at 0.17 h postchallenge in 824(pMSPOA) but not in 824(pGROE1) (C) (blue), and upregulated at 0.17 and/or 2 h in 824(pMSPOA) but not at all in 824(pGROE1) (D) (green). 824(pMSPOA) and 824(pIMP1) samples were taken at 0.17, 0.5, 1, 2, 6, 12, and 24 h after butanol stress. 824(pGROE1) and 824(pSOS95del) samples were taken at 0.25, 1, 3, 6, 12, and 24 h after butanol stress. Yellow triangle represents the direction of increasing time following butanol stress.
FIG. 8.
FIG. 8.
(A) Comparison of differential expression of genes due to butanol challenge in five experiments. Colored vertical bars indicate regions of interest shown in detail in panels with corresponding bars. (B through D) Detailed views of genes that were universally upregulated (B) (red), upregulated at 0.17 h postchallenge in 824(pMSPOA) but not in 824(pGROE1) (C) (blue), and upregulated at 0.17 and/or 2 h in 824(pMSPOA) but not at all in 824(pGROE1) (D) (green). 824(pMSPOA) and 824(pIMP1) samples were taken at 0.17, 0.5, 1, 2, 6, 12, and 24 h after butanol stress. 824(pGROE1) and 824(pSOS95del) samples were taken at 0.25, 1, 3, 6, 12, and 24 h after butanol stress. Yellow triangle represents the direction of increasing time following butanol stress.

References

    1. Baer, S. H., H. P. Blaschek, and T. L. Smith. 1987. Effect of butanol challenge and temperature on lipid composition and membrane fluidity of butanol-tolerant Clostridium acetobutylicum. Appl. Environ. Microbiol. 53:2854-2861. - PMC - PubMed
    1. Baer, S. H., D. L. Bryant, and H. P. Blaschek. 1989. Electron spin resonance analysis of the effect of butanol on the membrane fluidity of intact cells of Clostridium acetobutylicum. Appl. Environ. Microbiol. 55:2729-2731. - PMC - PubMed
    1. Baldus, J. M., B. D. Green, P. Youngman, and C. P. Moran. 1994. Phosphorylation of Bacillus subtilis transcription factor Spo0A stimulates transcription from the spoIIG promoter by enhancing binding to weak 0A boxes. J. Bacteriol. 176:296-306. - PMC - PubMed
    1. Bowles, L. K., and W. L. Ellefson. 1985. Effects of butanol on Clostridium acetobutylicum. Appl. Environ. Microbiol. 50:1165-1170. - PMC - PubMed
    1. Buday, Z., J. C. Linden, and M. N. Karim. 1990. Improved acetone butanol fermentation analysis using subambient HPLC column temperature. Enzyme Microb. Technol. 12:24-27.

Publication types

MeSH terms

LinkOut - more resources