Case Reports
. 2004 Mar 17;24(11):2690-8.
doi: 10.1523/JNEUROSCI.3089-03.2004.

A nonsense mutation of the sodium channel gene SCN2A in a patient with intractable epilepsy and mental decline

Affiliations
Case Reports

A nonsense mutation of the sodium channel gene SCN2A in a patient with intractable epilepsy and mental decline

Kazusaku Kamiya et al. J Neurosci. .

Abstract

Mutations, exclusively missense, of voltage-gated sodium channel alpha subunit type 1 (SCN1A) and type 2 (SCN2A) genes were reported in patients with idiopathic epilepsy: generalized epilepsy with febrile seizures plus. Nonsense and frameshift mutations of SCN1A, by contrast, were identified in intractable epilepsy: severe myoclonic epilepsy in infancy (SMEI). Here we describe a first nonsense mutation of SCN2A in a patient with intractable epilepsy and severe mental decline. The phenotype is similar to SMEI but distinct because of partial epilepsy, delayed onset (1 year 7 months), and absence of temperature sensitivity. A mutational analysis revealed that the patient had a heterozygous de novo nonsense mutation R102X of SCN2A. Patch-clamp analysis of Na(v)1.2 wild-type channels and the R102X mutant protein coexpressed in human embryonic kidney 293 cells showed that the truncated mutant protein shifted the voltage dependence of inactivation of wild-type channels in the hyperpolarizing direction. Analysis of the subcellular localization of R102X truncated protein suggested that its dominant negative effect could arise from direct or indirect cytoskeletal interactions of the mutant protein. Haploinsufficiency of Na(v)1.2 protein is one plausible explanation for the pathology of this patient; however, our biophysical findings suggest that the R102X truncated protein exerts a dominant negative effect leading to the patient's intractable epilepsy.


Figures

Figure 2.
Figure 2.
Initial phase of the ictal EEG of the patient with the R102X mutation of SCN2A. The EEG recorded during a convulsive seizure lasting 60 sec showed recruiting spike activities in the centroparietomidtemporal region on the left side before bilateralization. All the odd-numbered EEG electrodes were placed on the left side of the head, and even-numbered electrodes were placed on the right. She opened her eyes when her eyes were deviated toward the right along with retraction of the mouth corner on the same side, and then the head turned to the left, followed by convulsive movements of the whole body.
Figure 1.
Figure 1.
Nonsense mutation of SCN2A identified in a Japanese patient with intractable childhood epilepsy and severe mental decline. A, Pedigree tree of the Japanese family with febrile seizure (mother) and the intractable epilepsy (proband, arrow). The c.304C → T nonsense mutation was observed only in the proband. Circles, Females; square, male; filled circle, localization-related epilepsy; half-filled circle, febrile seizure. B, Electropherograms of the nonsense mutation R102X. Genomic PCR products were subcloned into a plasmid vector and sequenced separately (see Materials and Methods). The sequences from independent clones are shown in I–IV as examples. I and II show wild-type sequences, whereas III and IV show mutated sequences in which the arginine residue is altered to a stop codon. Fifteen of 37 subclones showed the nonsense mutation alike in III and IV. An examination of blood taken from the proband in another occasion reproduced a similar result, further confirming the existence of the c.304C → T (R102X) nonsense mutation in this patient.
Figure 3.
Figure 3.
A, Schematic representation of the predicted folding topology of Nav1.2. R102X nonsense mutation identified in a patient with intractable childhood epilepsy and severe mental decline locates at the N terminus. B, Schematic diagrams of human Nav1.2 expression constructs. Wild-type Nav1.2 (hNav1.2), the truncated mutant protein R102X, and the two fusion proteins Flag-tagged at N-terminal end (R102X-FlagN) and C-terminal end (R102X-FlagC) were constructed for further analysis. For details, see Materials and Methods.
Figure 4.
Figure 4.
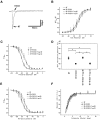
Voltage-gated sodium currents recorded from HEK293 cells expressing wild-type human Nav1.2 only (WT), coexpressed wild-type and mutant (WT+R102X, WT+R102X-FlagN, WT+R102X-FlagC), and mutant only (R102X). A, Sodium currents of the WT channel and R102X mutant protein. Currents were evoked by a step depolarization to 0 mV from a holding potential of –120 mV. B, Peak sodium conductance–voltage relationships for WT (open triangle), WT+R102X (filled circle), WT+R102X-FlagN (open circle), and WT+R102X-FlagC (open square). The data points represent the average of gNa. The lines represent the least squares fit of the data to a Boltzmann function, according to the equation gNa/maxgNa = 1/{1+exp[Vg0.5Vg]/kg}, wheremaxgNa is the maximum value for the Na+ conductance, gNa; Vg0.5 is the half-activation potential at which gNa is 0.5maxgNa; and kg is the slope factor. C, Steady-state voltage dependence of inactivation for each cell. Cells were prepulsed for 2 sec at various holding potentials (from –120 to 20 mV in 10 mV increments), and then Na+ current was evoked by a step depolarization to –10 mV. Imax is the peak amplitude of the Na+ current measured at a holding potential of –120 mV. The data points represent the average of I/Imax. The solid lines represent the least squares fit of the data to a Boltzmann function, according to the equation I/Imax = 1/{1 + exp[(VhV½)/k]}, where Imax is the magnitude of the peak Na+ current observed at a holding potential of –120 mV; Vh is the holding potential; V½ is the potential at which the Na+ current is half-maximal, and k is the slope factor. D, V½ values for each cell with a long prepulse (2 sec) shown in C (n = 12 or 13). Each point is given as mean ± SEM. *Statistical difference at 1% level. E, Steady-state voltage dependence of inactivation for each cell. Cells were pre pulsed for 200 msec at various holding potentials (from –120 to 20 mV in 10 mV increments), and then Na+ current was evoked by a step depolarization to –10 mV. Solid lines were fitted by the equation shown in C. F, Recovery from inactivated state. Recovery ratios from the inactivated state (I/Imax) were measured for various interpulse intervals. The curves were fitted using a Boltzmann function as described above. Each point is given as mean ± SEM.
Figure 5.
Figure 5.
Western blot analysis of wild type Nav1.2 (WT) and the truncated mutant proteins R102X and R102X tagged with Flag at the N terminus (R102X-FlagN) and C terminus (R102X-FlagC) in HEK293 cells. A, WT, R102X, and untransfected HEK293 cells probed with anti-Nav1.2 rabbit polyclonal antibody raised against residues 467–485 of human Nav1.2. HEK293 cells transfected with a wild-type Nav1.2-expressing construct show a positive signal above the 250 kDa molecular weight marker, whereas the R102X mutant-transfected cells and untransfected cells displayed no signal. B, Membrane fraction (M) and cytoplasmic fraction (C) of WT+R102X-FlagC cotransfected cells probed with anti-Nav1.2 rabbit polyclonal antibody. A band at ∼270 kDa was observed in the membrane fraction. C, Membrane fraction (M) and cytoplasmic fraction (C) of WT+R102X-FlagN and WT+R102X-FlagC probed with an anti-Flag monoclonal antibody. Distinct bands were observed at ∼16 kDa in cytoplasmic fractions.
Figure 6.
Figure 6.
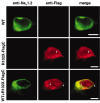
Immunocytochemistry of HEK293 cells transfected with expression constructs for wild-type Nav1.2 (WT) and the truncated mutant proteins R102X tagged with Flag at the C terminus (R102X-FlagC) and cotransfected cells (WT+R102X-FlagC). Each cell was double-stained by anti-Nav1.2 rabbit polyclonal antibody (green) and anti-Flag monoclonal antibody (red). Red fluorescence shows cytoskelton-like filament structures (arrowheads) in R102X-FlagC and WT+R102X-FlagC. Scale bars, 8 μm.
Figure 7.
Figure 7.
Effects of coexpression of β subunits on the functional properties of Nav1.2 (WT+β1+β2) and Nav1.2 with R102X (WT+R102X+β1+β2). A, Peak sodium conductance–voltage relationships for WT+β1+β2 (open triangle) and WT+R102X+β1+β2 (filled circle). Sodium currents were evoked by step depolarizations from a holding potential of –120 mV. The data points represent the average of gNa. The lines represent the least squares fit of the data to a Boltzmann function, according to the equation shown in Figure 4B. B, Steady-state voltage dependence of inactivation for each cell. Cells were prepulsed for 2 sec at various holding potentials (from –120 to 20 mV in 10 mV increments), and then Na+ current was evoked by a step depolarization to –10 mV. Imax is the peak amplitude of the Na+ current measured at a holding potential of –120 mV. The data points represent the average of I/Imax. The solid lines represent the least squares fit of the data to a Boltzmann function, according to the equation shown in Figure 4C. C, Steady-state voltage dependence of inactivation for each cell. Cells were prepulsed for 200 msec at various holding potentials (from –120 to 20 mV in 10 mV increments), and then Na+ current was evoked by a step depolarization to –10 mV. Solid lines were fitted by the equation shown in Figure 4C. D, Recovery from the inactivated state. Recovery ratios from the inactivated state (I/Imax) were measured for various interpulse intervals. The curves were fitted using a Boltzmann function as described above. Each point is given as mean ± SEM. The standard curves for WT shown in Figure 4 were overlaid on all figures as a dotted line.

References

    1. Ahmed CM, Ware DH, Lee SC, Patten CD, Ferrer-Montiel AV, Schinder AF, McPherson JD, Wagner-McPherson CB, Wasmuth JJ, Evans GA, Montal M (1992) Primary structure, chromosomal localization, and functional expression of a voltage-gated sodium channel from human brain. Proc Natl Acad Sci USA 89: 8220–8224. - PMC - PubMed
    1. Akai J, Makita N, Sakurada H, Shirai N, Ueda K, Kitabatake A, Nakazawa K, Kimura A, Hiraoka M (2000) A novel SCN5A mutation associated with idiopathic ventricular fibrillation without typical ECG findings of Brugada syndrome. FEBS Lett 479: 29–34. - PubMed
    1. Alekov AK, Rahman MM, Mitrovic N, Lehmann-Horn F, Lerche H (2001) Enhanced inactivation and acceleration of activation of the sodium channel associated with epilepsy in man. Eur J Neurosci 13: 2171–2176. - PubMed
    1. Baulac S, Gourfinkel-An I, Picard F, Rosenberg-Bourgin M, Prud'homme JF, Baulac M, Brice A, LeGuern E (1999) A second locus for familial generalized epilepsy with febrile seizures plus maps to chromosome 2q21–q33. Am J Hum Genet 65: 1078–1085. - PMC - PubMed
    1. Baulac S, Huberfeld G, Gourfinkel-An I, Mitropoulou G, Beranger A, Prud'homme JF, Baulac M, Brice A, Bruzzone R, LeGuern E (2001) First genetic evidence of GABA(A) receptor dysfunction in epilepsy: a mutation in the gamma2-subunit gene. Nat Genet 28: 46–48. - PubMed

Publication types

MeSH terms