. 2004 Mar 17;24(11):2760-73.
doi: 10.1523/JNEUROSCI.5120-03.2004.

Evidence for gaze feedback to the cat superior colliculus: discharges reflect gaze trajectory perturbations

Affiliations

Evidence for gaze feedback to the cat superior colliculus: discharges reflect gaze trajectory perturbations

Satoshi Matsuo et al. J Neurosci. .

Abstract

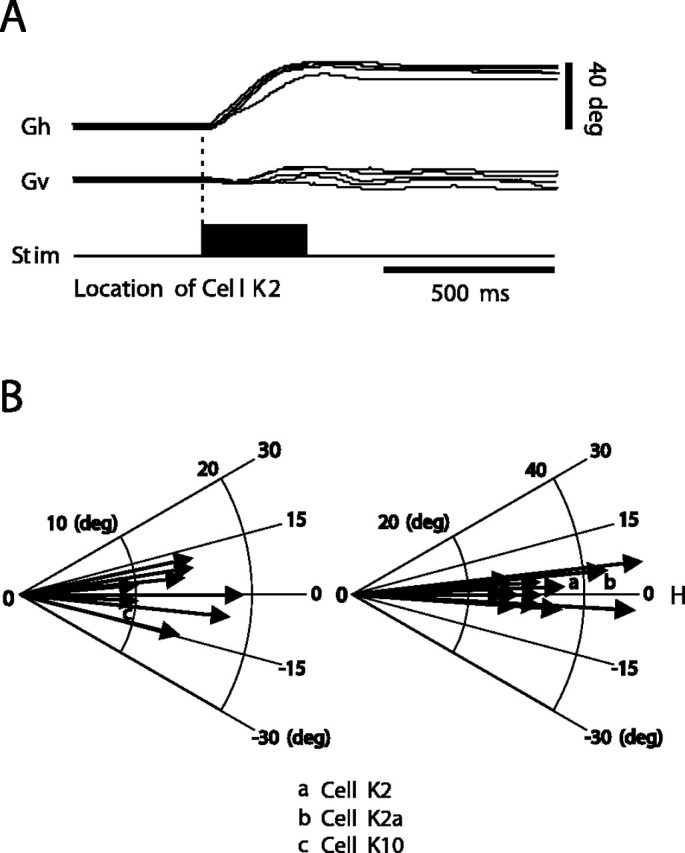
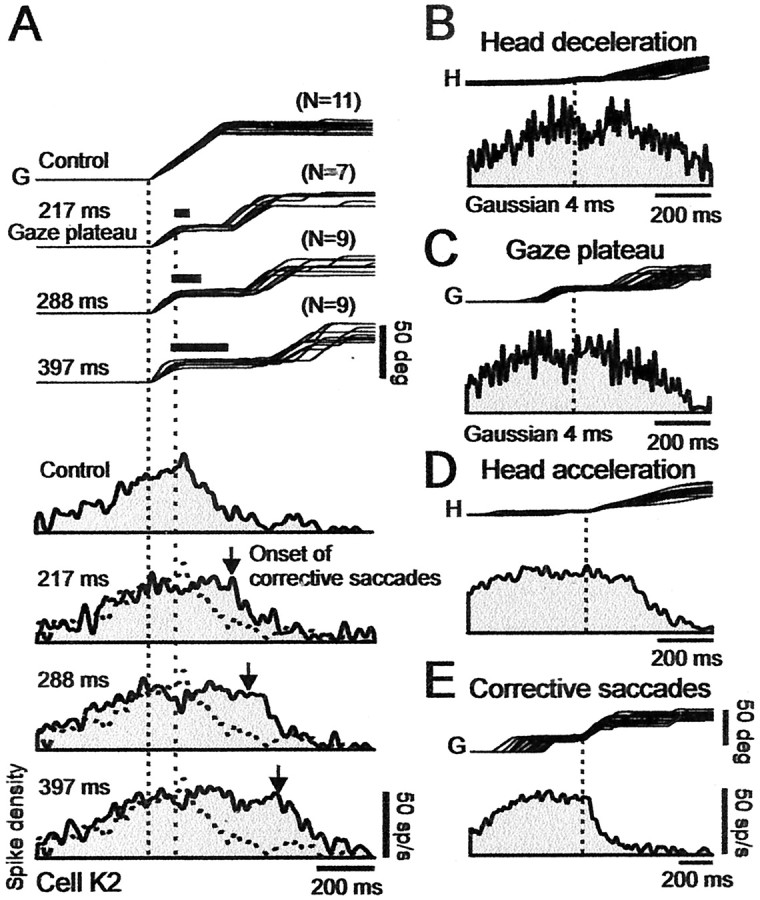
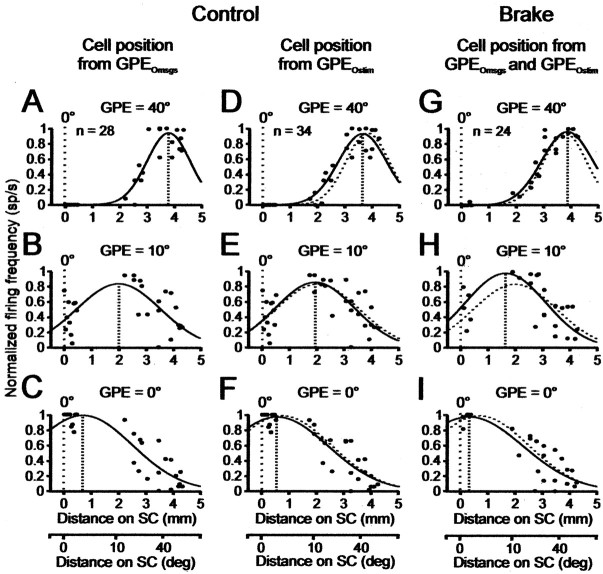
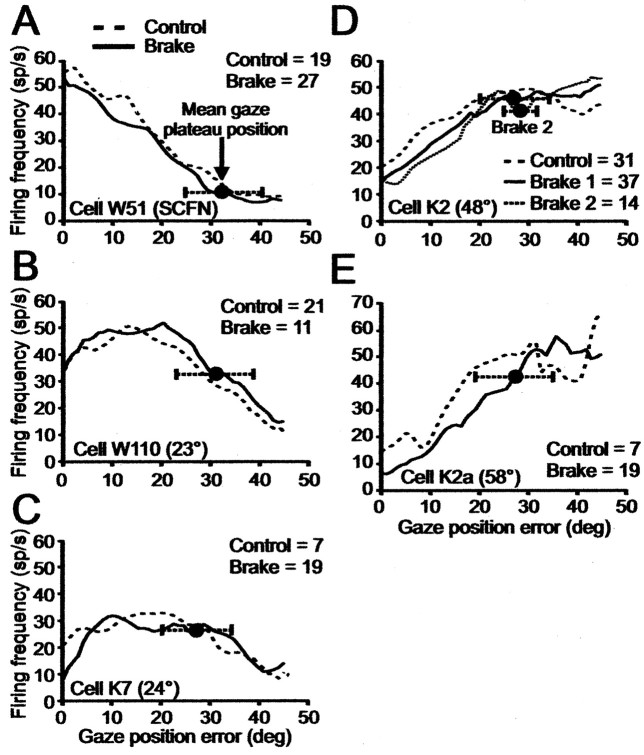
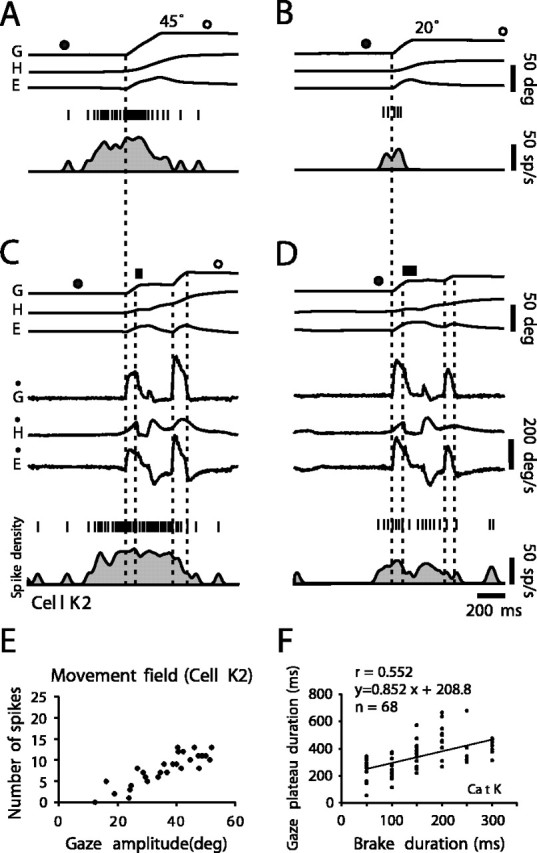
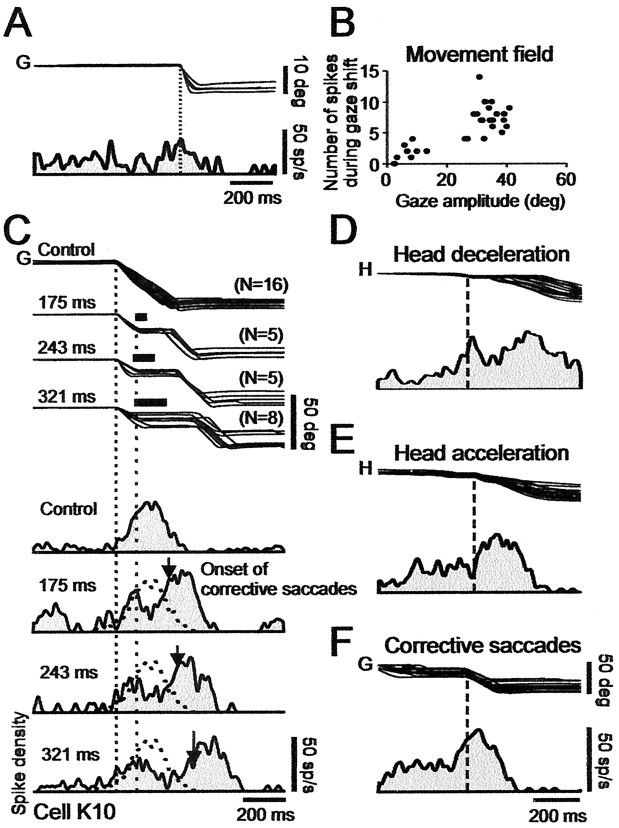
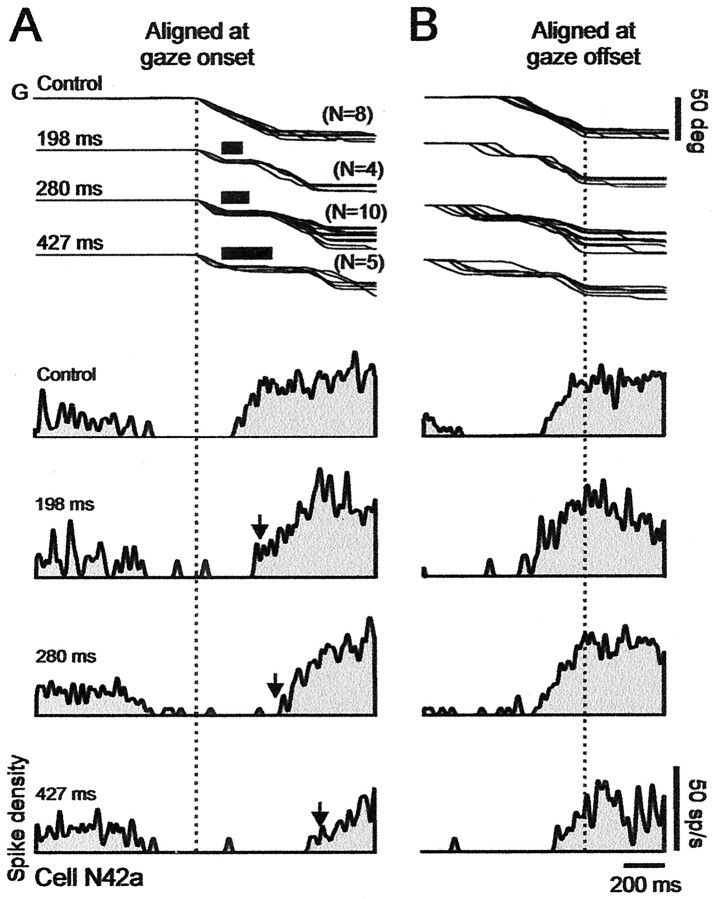
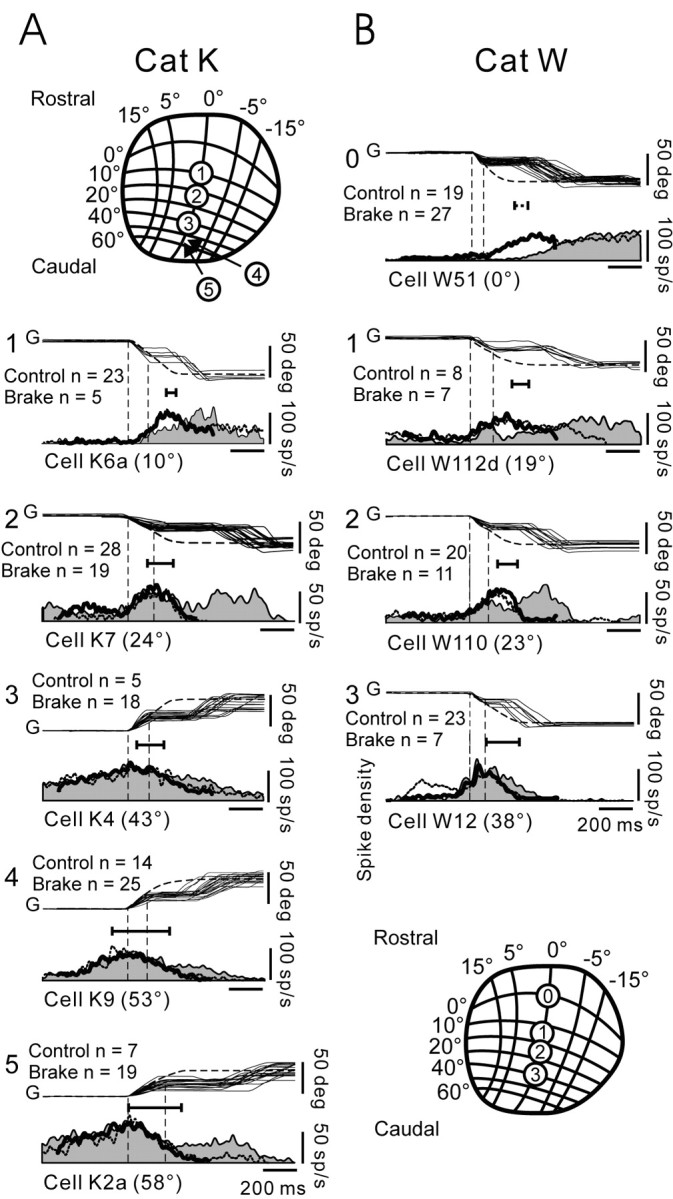
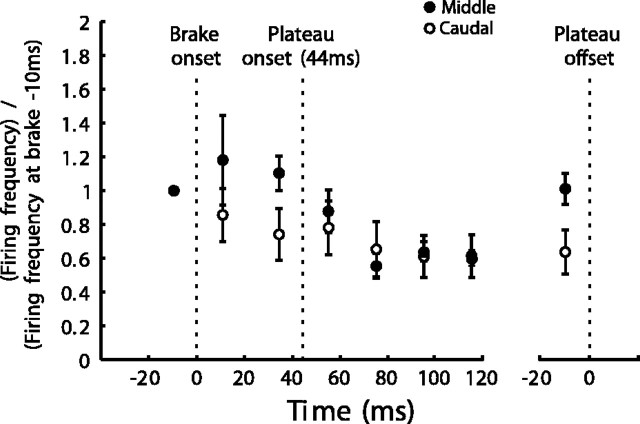
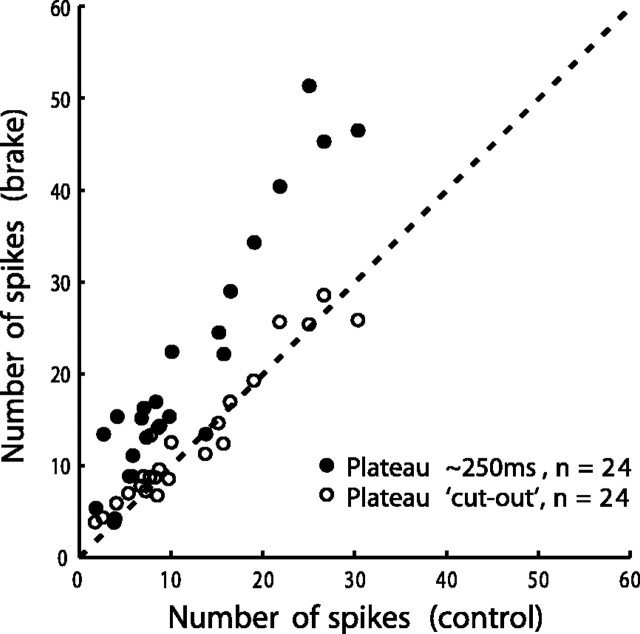
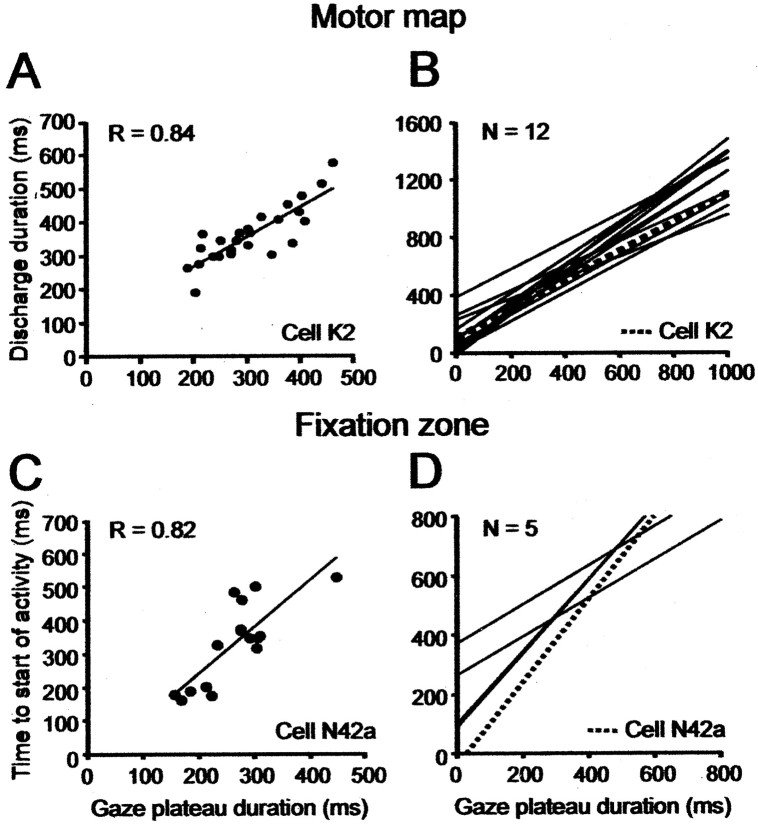
Rapid coordinated eye-head movements, called saccadic gaze shifts, displace the line of sight from one location to another. A critical structure in the gaze control circuitry is the superior colliculus (SC) of the midbrain, which drives gaze saccades by relaying cortical commands to brainstem eye and head motor circuits. We proposed that the SC lies within a gaze feedback loop and generates an error signal specifying gaze position error (GPE), the distance between target and current gaze positions. We investigated this feedback hypothesis in cats by briefly stopping head motion during large ( approximately 50 degrees ) gaze saccades made in the dark. This maneuver interrupted intended gaze saccades and briefly immobilized gaze (a plateau). After brake release, a corrective gaze saccade brought the gaze on goal. In the caudal SC, the firing frequency of a cell gradually increased to a maximum that just preceded the optimal gaze saccade encoded by the position of the cell and then declined back to zero near gaze saccade end. In brake trials, the activity level just preceding a brake-induced plateau continued steadily during the plateau and waned to zero only near the end of the corrective saccade. The duration of neural activity was stretched to reflect the increased time to target acquisition, and firing frequency during a plateau was proportional to the GPE of the plateau. In comparison, in the rostral SC, the duration of saccade-related pauses in fixation cell activity increased as plateau duration increased. The data show that the cat's SC lies in a gaze feedback loop and that it encodes GPE.


Figures

Figure 1.
Figure 1.
Gaze saccades evoked by stimulating the SC. A, A train of rectangular cathodal pulses (300 Hz; 300 msec duration) was delivered to the left SC at the position of cell K2. Stimulation evoked 38° right horizontal gaze movements. B, Representative, nearly horizontal, optimal vectors evoked at the sites where we recorded neurons in this study. Vectors a, b, and c in polar coordinates result from stimulation at the location of cells K2, K2a, and K10, discussed extensively in the text. Gh, Gaze horizontal; Gv, gaze vertical; Stim, stimulus; H, horizontal.
Figure 3.
Figure 3.
Effect of perturbing head (and therefore gaze) trajectories on discharges of cell K2 in caudal SC at 48° location. A, Gaze (G) traces show, from top to bottom, control and three selected brake conditions with mean gaze plateau durations of 217, 288, and 397 msec, respectively. Trials were also selected such that plateaus are about at a fixed position relative to the target, at GPE = 25 ± 5°. Number of superimposed trials in each condition is indicated at top right of each group of traces. The spike density histograms that correspond to each condition are shown sequentially below the gaze traces. All of the traces aligned on gaze onset (left vertical dotted line). Right vertical dotted line indicates start of brake-induced plateaus. Thick bars over plateaus indicate average duration of brake. Vertical down arrow in each spike density histogram indicates average time of onset of corrective gaze saccades. Note that firing frequency remained about constant during gaze plateau, and discharge duration increased with plateau duration. B, Effect of head brake on activity. Top trace shows the superimposed head (H) trajectories for all 35 brake trials in A, aligned on onset of head deceleration. Bottom trace shows associated weak transient depression in the average spike density histogram. C, Effect of head brake on activity during gaze plateau. Transient depression was over at start of plateau. D, Effect of head acceleration. Same as in B but with head traces now aligned on onset of head acceleration after brake release. Activity was not directly affected by head acceleration. E, Activity linked to corrective gaze saccades. Traces aligned on onset of corrective gaze saccades. Note the absence of saccade-related bursts, and that, during corrective saccades, activity decreased monotonically to near zero at gaze end. Spike density histograms were obtained using 10 msec (A, D, E) and 4 msec (B, C) Gaussian filters.
Figure 11.
Figure 11.
Spatial distribution of activity on the SC map at GPE of 40, 10, and 0°, respectively, during a 40° gaze shift. The value 10° is chosen, because it lies about midway on the map. Each point in a panel is one cell. Ordinate of each panel, Activity of each cell normalized to its mean peak value obtained at its preferred GPE in either control (single-step gaze shift) trials (A–F) or brake trials (G–I). Abscissa, Location of each cell on the map determined by its preferred GPE determined from either its discharge characteristics during multiple-step gaze shifts (GPEOmsgs) or by stimulating the recording site (GPEOstim). Cell position also converted to distance in millimeters (Table 1) (Materials and Methods). Curve in each panel is the best-fit Gaussian through the points. AC, Distribution of activity at different GPEs during a single-step 40° control gaze shifts when cell location on map is determined from GPEOmsgs. Number of available cells n = 28; includes 18 cells in Table 1 and 10 extra cells (Materials and Methods). D–F, Same as in AC, but with cell location determined by GPEOstim. Number of cells n = 34; includes 24 from Table 1 and 10 extra cells. G–I, Distribution of activity at the three GPEs during a braked single-step 40° control gaze shift when cell location on map is determined from GPEOmsgs and, when not available, from GPEOstim. Number of available cells n = 24 (all in Table 1). Dotted line in each panel reproduces the control value at the identified GPE in AC. Note that control and brake trial distributions are statistically identical (p ≥ 0.05; K–S test). Distribution in each panel shows that peak activity is correctly located on the map to encode the current GPE. The peak moves caudorostrally along the map during gaze shifts, thereby keeping track of current GPE, and stops during brake-induced plateaus. See Spatial Distribution of Activity on Motor Map during Gaze Shifts.
Figure 10.
Figure 10.
Phase plane plots showing dependence of firing frequency on GPE in control and brake trials. Time is not explicitly shown in these plots. Each panel shows data for one cell. A–E are arranged in order of the rostrocaudal location of each cell on the SC map; fixation cell W51 is in A. In each panel, dashed and full lines show phase plane plots of average spike density for control and perturbed gaze shifts at each GPE. Number of trials in each condition is given in each panel. Mean plateau position is indicated by full circle with ±1 SD given by horizontal dotted line terminated by tic marks. In D, we selected a subset of 14 brake trials with plateau GPEs at 29 ± 3° (dotted line), a narrower range than for the solid line. Note for each panel that the phase plane plots in each condition are statistically identical (Materials and Methods) (p ≥ 0.05; K–S test).
Figure 2.
Figure 2.
Coordinated eye–head movements in cat K and associated discharge of typical cell K2 in caudal left SC at the 48° location. A, Horizontal gaze (G), eye (E), and head (H) positions during a large control gaze shift of amplitude 45°. Upward deflections indicate rightward movements. The bottom trace shows neuron firing frequency given as a spike density function. Above are vertical tic marks representing action potentials. Closed and open circles above G trace indicate offset and onset of ambient lighting. This and all of the other illustrated gaze shifts were made in complete darkness. B, Discharge of cell during a control gaze shift of small amplitude (20°). Note lower firing frequency compared with large movement. C, Discharge of cell during a perturbed gaze shift of same intended amplitude (45°) as control. Brake duration, 50 msec, indicated by thick bar over G trace. Vertical dotted lines indicate, respectively from left to right, gaze onset, brake onset, end of the gaze plateau, and end of the corrective gaze saccade. Ġ,Ė, and Ḣ, Gaze, head, and eye velocity. Note that cell continued discharging at same frequency during gaze plateau. D, Discharge of cell during a perturbed gaze shift of small amplitude (20° as in B). Brake duration, 100 msec. Activity continued during gaze plateau, but there was a transient suppression just after head perturbation. E, Relationship between number of spikes during single-step control gaze shifts and gaze amplitude. The cell had an open-ended movement field. F, Relationship between gaze plateau duration and brake duration. Correlation is not strong, because eye and head moved in opposite directions after brake release and so lengthened gaze plateau relative to brake duration.
Figure 4.
Figure 4.
Discharge of cell K10, in middle right SC at 19° location, during control and perturbed gaze shifts. A, Ten degree gaze (G) shifts and associated cell discharge. B, Number of spikes in a discharge versus gaze saccade amplitude. Cell discharges for all of the gaze shifts larger than its 19° optimum (i.e., it has an open-ended movement field). C, Discharge during large gaze shifts. Top traces show superimposed gaze trajectories in control trials (top gaze traces) and different brake trials selected to have plateaus at about a fixed GPE of ∼20°. The illustrated gaze traces have gaze plateau durations with means of 175, 243, and 321 msec. Traces below gaze trajectories show the spike density waveforms associated with the different plateau durations. All of the traces aligned on gaze onset (left vertical dotted line). Onset of plateaus indicated by right vertical dotted line. Thick bars over plateaus indicate average duration of brake. In control trials, peak discharge lagged onset of large gaze saccades. For perturbed trials, arrows on spike density histograms indicate average time of onset of corrective gaze saccades. After brake onset, firing frequency first declined and then increased before corrective gaze saccade. Overall discharge duration increased with plateau duration. D, Effect of brake. Superposition of all of the brake trials in C, aligned on head deceleration (vertical dotted line). The discharge was suppressed shortly after head (H) decelerates. E, Effect of brake release. Same traces as in D, now aligned on onset of the head acceleration (vertical dotted line) that followed brake release. Activity increased after the head was released. F, Burst-like activity before corrective gaze saccades. Same traces as in D aligned on onset of ∼30° corrective gaze saccades (vertical dotted line). Note that peak discharge lagged saccade onset, compatible with moving-hill hypothesis. All of the spike density profiles were obtained using 10 msec Gaussians filter.
Figure 5.
Figure 5.
Discharge of collicular fixation cell N42a during control and perturbed trials. Prolongation of pause in activity during perturbed gaze (G) shifts. A, Traces aligned on onset of gaze shifts. Superimposed gaze traces at top of panel show control trials. The three below show brake trials. Traces of brake trials show, from top to bottom, mean gaze plateau durations of 198, 280, and 427 msec. Thick bars over plateaus indicate average duration of brake. Bottom four traces in panel show sequentially the spike density histograms associated with the control and different plateau durations. Note that pause in activity increased with plateau duration. Arrows indicate end of plateaus. B, Traces aligned on gaze shift end. Note that activity peaks at end in both control and brake trials. Spike density histograms use 10 msec Gaussian filter.
Figure 6.
Figure 6.
Discharge patterns of cells at different rostrocaudal locations on SC map. A, B, Data for cats K and W, respectively. A, Top; B, Bottom, Schema of the gaze motor map in SC (taken from Feldon et al., 1970) with numbers showing the recording sites of cells in corresponding panels of the same column. Cells in each column are arranged from top to bottom according to their rostrocaudal location on the map. Each panel shows the mean control gaze (G) profile (dashed line) and some superimposed brake trials, selected to have about constant plateau duration and GPE, and below, the associated mean firing-frequency profiles. All of the traces are aligned on gaze onset (left vertical dotted line). Onset of plateaus is indicated by right vertical dotted line. The profile for brake trials is filled in, and the control profile is a dotted line. The thick black line in each panel shows the firing-frequency profile that results when plateaus have been cut out and the two ends slid toward each other. For most cells, these are similar to control profiles. Number of control and brake trials in each panel is indicated. Horizontal line below gaze traces in each panel shows time of occurrence of peak discharge relative to the end of the mean control gaze shift; left tic mark on line identifies time of peak discharge; right tic mark is at gaze shift end. See Overview of Population Discharges for additional details.
Figure 7.
Figure 7.
Evolution with time of postbrake mean activity for two populations of cells in the caudal and middle SC, respectively. Caudal cells (open circles), Mean of the mean discharge of each of cells K2, K5, K9, K9a, and K2a. Same for middle cells (dark circles): K7, K10, W112d, and W110. Activity levels for both populations normalized to the mean value in the 20 msec period before brake onset. Mean time between brake and plateau onsets was 44.5 msec. The activity levels in the 20 msec period before plateau end are shown to far right. Short vertical lines through each point indicate SE. Note that, for both populations, the activity levels at the start and end of plateaus were equal despite a transient decrease during the plateau. See Activity during Brake-Induced Gaze Plateaus for details.
Figure 8.
Figure 8.
Comparison of number of spikes in control and brake trials (Materials and Methods). Filled circles show data for brake trials selected such that plateau duration was ∼250 msec. Each point represents one cell. Number of cells n = 24. For all of the cells except two (see Gaze Plateaus Prolong Caudal Cell Tonic Discharges and SC FM Pauses), there were more spikes in brake trials than in control trials. Open circles give number of spikes in the brake trials after the plateaus have been cut out.
Figure 9.
Figure 9.
Effect of gaze plateau duration on cell discharges. Data from perturbed trials. A, Duration of overall cell discharge is proportional to gaze plateau duration (cell K2). Each point represents a single trial. Discharge duration, measured from 10 msec before onset of first gaze saccade to when activity, during the postplateau corrective saccades, had decreased to 30% of peak discharge. Linear regression correlation coefficient r = 0.84. B, Regression lines of discharge duration versus gaze plateau duration for all 12 cells in the caudal SC, posterior to the 3 mm location (Table 1). C, Dependence of the duration of fixation cell-suppressed activity (the pause) on gaze plateau duration (SCFN; cell N42a). Pause duration measured from gaze start to when activity had increased to 70% of its peak value. D, Same plot as in A but for population of five SCFNs.

References

    1. Aizawa H, Wurtz RH (1998) Reversible inactivation of monkey superior colliculus. I. Curvature of saccadic trajectory. J Neurophysiol 79: 2082–2096. - PubMed
    1. Anderson RW, Keller EL, Gandhi NJ, Das S (1998) Two-dimensional saccade-related population activity in superior colliculus in monkey. J Neurophysiol 80: 798–817. - PubMed
    1. Bergeron A, Guitton D (2000) Fixation neurons in the superior colliculus encode distance between current and desired gaze positions. Nat Neurosci 3: 932–939. - PubMed
    1. Bergeron A, Guitton D (2002) In multiple-step gaze shifts: omnipause (OPNs) and collicular fixation neurons encode gaze position error; OPNs gate saccades. J Neurophysiol 88: 1726–1742. - PubMed
    1. Bergeron A, Matsuo S, Guitton D (2003) Superior colliculus encodes distance to target, not saccade amplitude, in multi-step gaze shifts. Nat Neurosci 6: 404–413. - PubMed

Publication types

LinkOut - more resources