. 2004 Mar 17;24(11):2774-81.
doi: 10.1523/JNEUROSCI.4637-03.2004.

Presynaptic NMDA receptors modulate glutamate release from primary sensory neurons in rat spinal cord dorsal horn

Affiliations

Presynaptic NMDA receptors modulate glutamate release from primary sensory neurons in rat spinal cord dorsal horn

Rita Bardoni et al. J Neurosci. .

Abstract

NMDA receptors have the potential to produce complex activity-dependent regulation of transmitter release when localized presynaptically. In the somatosensory system, NMDA receptors have been immunocytochemically detected on presynaptic terminals of primary afferents, and these have been proposed to drive release of substance P from central terminals of a subset of nociceptors in the spinal cord dorsal horn. Here we report that functional NMDA receptors are indeed present at or near the central terminals of primary afferent fibers. Furthermore, we show that activation of these presynaptic receptors results in an inhibition of glutamate release from the terminals. Some of these NMDA receptors may be expressed in the preterminal axon and regulate the extent to which action potentials invade the extensive central arborizations of primary sensory neurons.


Figures

Figure 1.
Figure 1.
Functional NMDA receptors are expressed near primary afferent terminals. A, Schematic drawing of the recording setup. Hemisected spinal cord and the dorsal root were placed across a Vaseline seal. A glass suction electrode was placed on the dorsal root to record primary afferent depolarization. Drugs were only applied to the spinal cord compartment. B, The voltage response from primary afferents, or PAD, was recorded from the root. NMDA at 50 μm was able to induce depolarization that was significantly blocked by 50 μm APV, indicating that the response was mediated by NMDA receptors. C, The average depolarizations were measured and plotted for each condition indicated under each group of bar graphs. The asterisks represent significant difference based on repeated measures ANOVA, followed by Newman–Keuls post hoc tests (p < 0.05). D, NMDA at 50μm was able to induce depolarization that was significantly blocked but not abolished by the addition of 1 mm Mg2+ to the extracellular solution. The average depolarizations were measured and plotted for each condition indicated under each group of bar graphs. The asterisk represents significant difference based on repeated measures ANOVA, followed by Newman–Keuls post hoc tests (p < 0.05). E, Bar graph demonstrating the degree of inhibition of NMDA-induced PAD produced by the addition of 1 mm Mg2+ and 10 mm Mg2+ to the extracellular solution. The inhibition of NMDA-induced PAD produced by 10 mm Mg2+ was significantly greater than that produced by 1 mm Mg2+ (Mann–Whitney U test; p < 0.05).
Figure 4.
Figure 4.
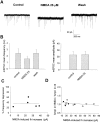
NMDA application significantly depresses mEPSC frequency but does not cause any significant change of mEPSC amplitude. A, Examples of mEPSCs recorded from a P9 lamina II neuron in control, 25 μm NMDA, and wash. Recordings were obtained at –85 mV, in the constant presence of 0.5 μm TTX. NMDA application depresses mEPSC frequency without affecting the amplitude. B, Histograms showing the effect of 25 μm NMDA on mEPSC mean frequency (left; n = 5) and on mEPSC mean amplitude (right; n = 4). The mean frequency was significantly depressed (paired t test; p < 0.05), whereas the mean amplitude was unchanged (paired t test; p > 0.05). C, The percentage of mEPSC frequency depression in 25 μm NMDA is represented as a function of the NMDA-induced holding current increase. There is no significant correlation between the two parameters (r2 = 0.0003; p > 0.05). D, The graph represents the ratios between the mean values of mEPSC amplitude, obtained from 11 lamina II neurons (filled circles, 25 μm NMDA; open circles, 50 μm NMDA) and in control, plotted as a function of the NMDA-induced holding current increase. There is no significant correlation between the two parameters (r2 = 0.149; p > 0.05).
Figure 2.
Figure 2.
NMDA application causes a depression of evoked AMPA receptor-mediated EPSCs in lamina II neurons and induces synaptic failures. A, Schematic drawing of the recording setup. B, AMPA receptor-mediated EPSCs recorded from a lamina II neuron, held at –85 mV, obtained from a P11 rat. NMDA at 50μm rapidly caused a significant depression of AMPA EPSC amplitude, initial increase and later decrease of spontaneous activity, and the appearance of synaptic failures, and produced a constant postsynaptic current. C, Inhibitory effect of 10, 25, and 50μm NMDA expressed as mean percentage of AMPA EPSC peak amplitude depression. The application of 50 μm d-APV significantly antagonized the depressant effect of 50 μm NMDA (p < 0.01). Numbers above the bars represent the number of cells with significant depression over the total number of tested cells. D, Histogram showing the percentage of synaptic failures induced by 10, 25, and 50 μm NMDA on AMPA EPSCs. Numbers above the bars represent the number of cells in which synaptic failures were observed over the total number of tested cells.
Figure 3.
Figure 3.
NMDA application evokes a dose-dependent, NMDA receptor-mediated whole-cell current in lamina II neurons. A, The amplitude of the change in holding current, recorded in the presence of 50 μm NMDA, is plotted as function of membrane potential. Each value represents the average of 10 traces recorded from a lamina II neuron from a P3 rat. The I–V curve shows the characteristic J-shape of NMDA receptors. B, Mean amplitude of the increase in holding current, recorded at –85 mV, in the presence of 10, 25, and 50 μm NMDA. The amplitude of the current evoked by NMDA is dose dependent and significantly depressed by the application of d-APV (p < 0.05). Numbers on top of each bar represent the number of cells tested in each condition.
Figure 5.
Figure 5.
AMPA EPSC depression mediated by presynaptic NMDA receptors is not significantly attributable to activation of dorsal horn interneurons. A, Average traces of AMPA EPSCs recorded at –85 mV from a lamina II neuron from a P11 rat, in a mixture (Cocktail) containing 20μm SCH50911, 50μm PPADS, 10μm DPCPX, 25μm LY341495, and 100μm MPPG (bicuculline and strychnine are also included). The application of 50μm NMDA was still able to induce a significant depression of AMPA EPSC amplitude. B, The histogram compares the mean percentage of AMPA EPSC depression in 50 μm NMDA alone with the depression in 50 μm NMDA plus mixture. The amount of depression obtained in NMDA plus mixture is not significantly different from the inhibition obtained in NMDA alone (unpaired t test; p > 0.05). Numbers above each bar represent the number of tested cells.
Figure 6.
Figure 6.
Activation of NMDA receptors on primary afferents increases the latency of monosynaptic AMPA EPSCs. A, AMPA EPSCs recorded at –85 mV from a lamina II neuron from a P11 rat. NMDA at 50μm significantly prolonged the response latency. B, Same as in A, but all traces are superimposed (control, gray; NMDA, dashed line; wash, black). C, Summary of the NMDA effect on EPSC latency, tested at different concentrations and in mixture (Cocktail). Numbers on top of each bar represent the number of cells in which the latency shift was significant over the total number of cells tested.

References

    1. Agrawal SG, Evans RH (1986) The primary afferent depolarizing action of kainate in the rat. Br J Pharmacol 87: 345–355. - PMC - PubMed
    1. Alvarez FJ (1998) Anatomical basis for presynaptic inhibition of primary sensory fibers. In: Presynaptic inhibition and neural control (Rudomin P, Romo R, Mendell LM, eds), pp 13–50. New York: Oxford UP.
    1. Armstrong CM, Bezanilla F (1974) Charge movement associated with the opening and closing of the activation gates of Na channels. J Gen Physiol 63: 533–552. - PMC - PubMed
    1. Bardoni R, Belluzzi O (1993) Kinetic study and numerical reconstruction of A-type current in granule cells of rat cerebellar slices. J Neurophysiol 6: 2222–2231. - PubMed
    1. Bardoni R, Magherini PC, MacDermott AB (1998) NMDA EPSCs at glutamatergic synapses in the spinal cord dorsal horn of the postnatal rat. J Neurosci 18: 6558–6567. - PMC - PubMed

Publication types

MeSH terms

LinkOut - more resources