Comparative Study
. 2004 Jul 1;104(1):270-80.
doi: 10.1182/blood-2003-08-2760. Epub 2004 Mar 18.

Blood mononuclear cell gene expression profiles characterize the oxidant, hemolytic, and inflammatory stress of sickle cell disease

Affiliations
Comparative Study

Blood mononuclear cell gene expression profiles characterize the oxidant, hemolytic, and inflammatory stress of sickle cell disease

Maria L Jison et al. Blood. .

Abstract

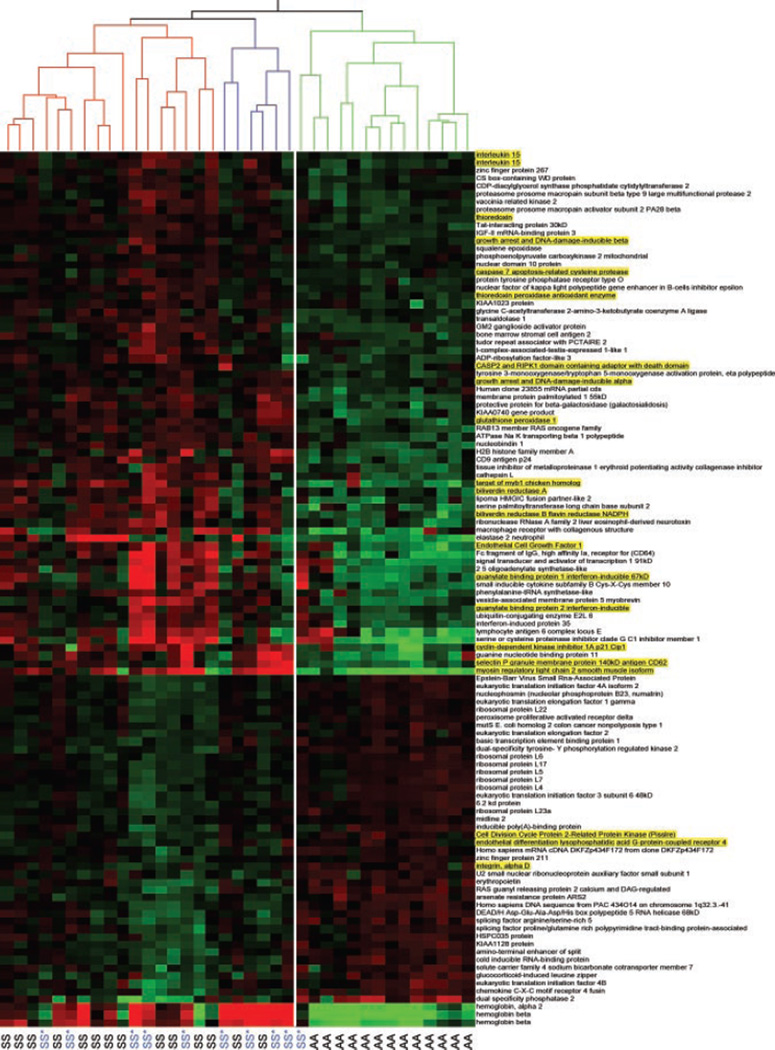
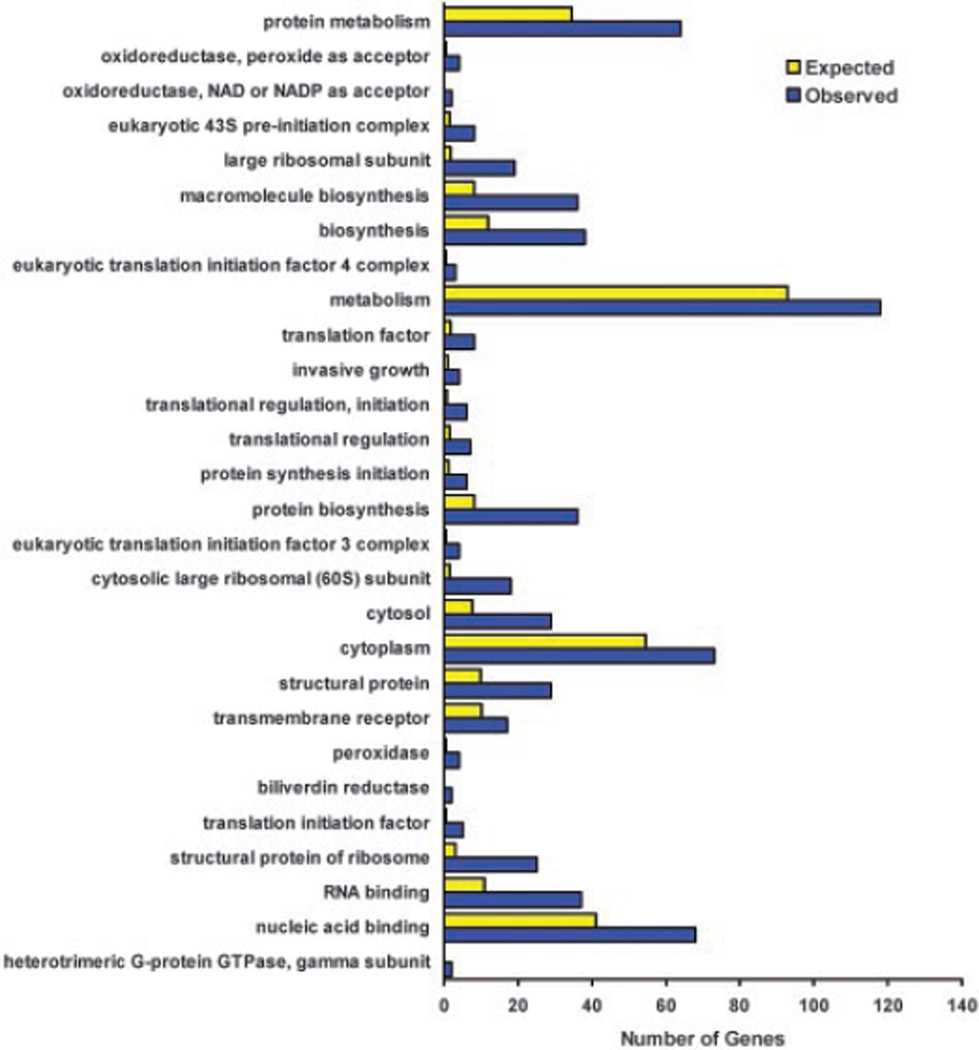
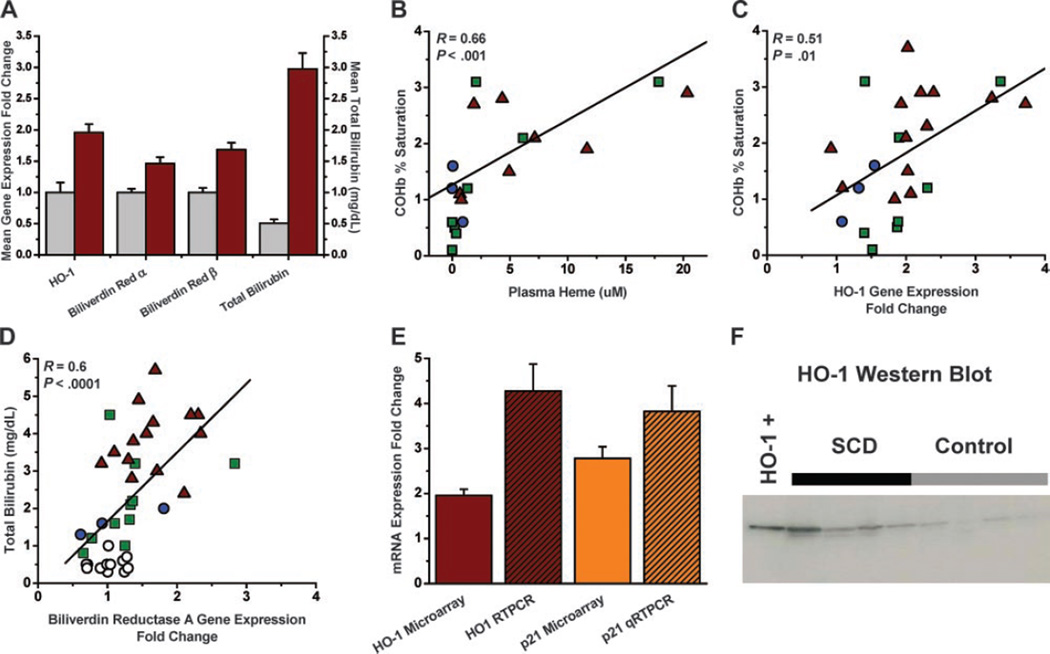
In sickle cell disease, deoxygenation of intra-erythrocytic hemoglobin S leads to hemoglobin polymerization, erythrocyte rigidity, hemolysis, and microvascular occlusion. Ischemia-reperfusion injury, plasma hemoglobin-mediated nitric oxide consumption, and free radical generation activate systemic inflammatory responses. To characterize the role of circulating leukocytes in sickle cell pathogenesis we performed global transcriptional analysis of blood mononuclear cells from 27 patients in steady-state sickle cell disease (10 patients treated and 17 patients untreated with hydroxyurea) compared with 13 control subjects. We used gender-specific gene expression to validate human microarray experiments. Patients with sickle cell disease demonstrated differential gene expression of 112 genes involved in heme metabolism, cell-cycle regulation, antioxidant and stress responses, inflammation, and angiogenesis. Inducible heme oxygenase-1 and downstream proteins biliverdin reductase and p21, a cyclin-dependent kinase, were up-regulated, potentially contributing to phenotypic heterogeneity and absence of atherosclerosis in patients with sickle cell disease despite endothelial dysfunction and vascular inflammation. Hydroxyurea therapy did not significantly affect leukocyte gene expression, suggesting that such therapy has limited direct anti-inflammatory activity beyond leukoreduction. Global transcriptional analysis of circulating leukocytes highlights the intense oxidant and inflammatory nature of steady-state sickle cell disease and provides insight into the broad compensatory responses to vascular injury.


Figures

Figure 1
Figure 1. Heirarchical cluster analysis of 14 gender-specific genes as a novel validation of microarray expression data
Genes were chosen on the basis of comparison of mean gene expression levels between 8 male and 6 female sickle cell disease patients (HbSS phenotype only, designated as either M-SS for males or F-SS for females) with false discovery rate of less than or equal to 10%. Hierarchical cluster analysis of the expression pattern of these 16 probe sets (14 genes) in all sickle cell disease patients (HbSS phenotype), including the original 14 subjects as well as 10 additional sickle cell disease patients on hydroxyurea (M-SS* or F-SS*) and 13 controls (M-AA or F-AA) show that they discriminate gender with 100% accuracy. In this figure each column represents a sickle cell disease patient or a control subject and each row represents a probe set. Red signifies increased expression and green signifies decreased expression. Genes that are up-regulated in males over females are generally located on the Y chromosome and genes that are up-regulated in females over males are generally located on the X chromosome. One gene, plakophilin 2, maps to an autosomal location and has a low overall expression level. With the selected false discovery rate of less than or equal to 10% one would only expect 1 or 2 false positives. Eukaryotic translation initiation factor 1A is represented by 3 different probe sets. All 4 X-linked genes (underlined and highlighted in yellow) represent X chromosome genes known to escape X inactivation. This specificity is a remarkable additional validation of the experimental and analytical methodology.
Figure 2
Figure 2. Hierarchical cluster analysis of 112 significantly differentially expressed genes successfully segregates sickle cell disease from control patients
These genes were derived using 2-way ANOVA, false discovery rate multiple comparisons correction of less than or equal to 5%, more than or equal to 20% fold-change cut-off, and a mean average difference more than 20 filter in either the sickle cell disease or control group. These 112 genes were obtained comparing mean gene expression levels in 14 sickle cell disease patients of HbSS phenotype (not on hydroxyurea therapy) to 13 African-American control subjects. Hierarchical clustering was performed across a larger set of all sickle cell disease patients (HbSS phenotype only) in the study, including patients on hydroxyurea treatment, using these 112 genes. The dendrogram at the top of the figure represents the relatedness of samples based on gene expression patterns. The white line separates the 2 main branches of the dendrogram. With the exception of one sickle cell patient on hydroxyurea, these 112 genes successfully segregate control (AA) from sickle cell disease (SS or SS*) patients. Sickle cell disease patients on hydroxyurea (SS*) therapy do not cluster separately from patients not on therapy. The single sickle cell patient on hydroxyurea who clustered with the control group may represent a misclassification or hydroxyurea altered the gene expression toward a normalized pattern. Gene names appear to the right of the figure and those of particular interest to our group are underlined and highlighted in yellow.
Figure 3
Figure 3. GO-Scan classifications of 385 significantly differentially expressed genes
The x axis reflects the number of genes in a particular category of annotations from our list of 385 genes (generated using a less stringent multiple comparisons correction: false discovery rate ≤ 10%). Blue: observed number; yellow: expected number, based on the total number of genes on the chip given each annotation term multiplied by the average differential expression rate (number of differentially expressed, annotated genes/number of annotated genes). Annotation terms were selected from GO-Scan when they were significantly overrepresented in the list of differentially expressed genes. Significance was determined with a Fisher exact test and P less than or equal to .01. Individual genes from selected categories are listed in Table 3.
Figure 4
Figure 4. The potential role of the heme oxygenase-1 pathway and downstream effectors in the compensatory response to repeated ischemia-reperfusion injury and hemolytic stress in sickle cell disease
Red text represents up-regulated genes or molecules measured in this study in sickle cell patients. CO indicates carbon monoxide; cGMP, cyclic guanosine monophosphate; p38MAPK, p38 mitogen-activated protein kinase; p21, a cyclin-dependent kinase inhibitor.
Figure 5
Figure 5. Validation of gene expression data for the HO-1 pathway and p21
Gene expression levels are reflected as arbitrary units of fold-change of expression relative to mean control levels. Black lines in B, C, and D are regression lines. (A) Sickle cell disease patients (red bars) have increased mean gene expression (left y-axis) of all enzymes in the heme catabolism pathway and have higher mean serum total bilirubin (right y-axis), the end product of heme breakdown, compared with healthy volunteers (gray bars). Error bars reflect SEM. (B) Carbon monoxide production (determined by carboxy hemoglobin levels measured by co-oximetry) was measured in 24 patients with sickle cell disease (13 HbSS not on hydroxyurea therapy [▲], 8 HbSS on hydroxyurea [■], 2 HbSC and 1 HbSβ-thalassemia phenotype [○]). Carbon monoxide production correlates with plasma heme levels measured by benzidine assay. (C) Carbon monoxide production correlates with HO-1 gene expression measured by microarray in these same 24 sickle cell disease patients. (D) Serum total bilirubin levels were measured in 27 sickle cell disease patients (14 HbSS not on hydroxyurea therapy [▲], 10 HbSS on hydroxyurea [■], 2 HbSC and 1 HbSβ-thalassemia phenotype [○], and 13 controls [●]). Serum total bilirubin correlates with biliverdin reductase gene expression measured by microarray. Gene expression levels for biliverdin reductase also correlate with CO production (r = 0.55, P < .005, data not shown). (E) HO-1 and p21 gene expression measured by microarray and real-time PCR show increased expression in 27 sickle cell disease patients. Error bars reflect SEM. (F) Patients with sickle cell disease (n = 4) have increased cellular HO-1 protein levels in their peripheral blood mononuclear cells compared with healthy volunteers (n = 4) as measured by Western blot. Lane 1 represents an HO-1-positive control.
Figure 6
Figure 6. Comparison of gene expression patterns of sickle cell disease to those of a general inflammatory state
Genes were selected based on the comparison of mean gene expression levels between sickle cell disease patients and African-American healthy volunteers using a 1.2 fold-change cut off, an average difference more than 20 filter in either sickle cell disease or control group and a less than or equal to 5% false discovery rate multiple comparisons correction. Cluster analysis was applied to gene expression data from sickle cell disease patients of HbSS phenotype on (SS*) or off (SS) hydroxyurea therapy, African-American healthy volunteers (AA), a separate set of healthy volunteers (Pre LPS), and these same volunteers following intravenous endotoxin infusion (Post LPS). This figure shows that there are similarities in gene expression patterns for these 112 genes between sickle cell disease and an inflammatory state induced by endotoxin infusion. Importantly, there are clusters of genes, marked by the blue bars to the left of the figure, that show differential expression between sickle cell disease and endotoxin infusion, suggesting that the gene expression changes observed in sickle cell disease are not due solely to a generalized inflammatory state but are specific for sickle cell disease.

References

    1. Bunn HF. Pathogenesis and treatment of sickle cell disease. N Engl J Med. 1997;337:762–769. - PubMed
    1. Noguchi CT, Haley JD, Abraham DJ, Schechter AN. Inhibition of sickle hemoglobin polymerization as a basis for therapeutic approaches to sickle cell anemia. In: Abraham DJ, editor. Burger’s Medicinal Chemistry. III. New York, NY: Wiley and Sons; 2003. pp. 443–479.
    1. Kaul DK, Hebbel RP. Hypoxia/reoxygenation causes inflammatory response in transgenic sickle mice but not in normal mice. J Clin Invest. 2000;106:411–420. - PMC - PubMed
    1. Osarogiagbon UR, Choong S, Belcher JD, Vercellotti GM, Paller MS, Hebbel RP. Reperfusion injury pathophysiology in sickle transgenic mice. Blood. 2000;96:314–320. - PubMed
    1. Serjeant GR. Sickle Cell Disease. 2nd. New York, NY: Oxford University Press; 1992.

Publication types

MeSH terms