. 2004 Apr;16(4):956-66.
doi: 10.1105/tpc.020214. Epub 2004 Mar 18.

Circadian and diurnal calcium oscillations encode photoperiodic information in Arabidopsis

Affiliations

Circadian and diurnal calcium oscillations encode photoperiodic information in Arabidopsis

John Love et al. Plant Cell. 2004 Apr.

Abstract

We have tested the hypothesis that circadian oscillations in the concentration of cytosolic free calcium ([Ca2+]cyt) can encode information. We imaged oscillations of [Ca2+]cyt in the cotyledons and leaves of Arabidopsis (Arabidopsis thaliana) that have a 24-h period in light/dark cycles and also constant light. The amplitude, phase, and shape of the oscillations of [Ca2+]cyt and [Ca2+]cyt at critical daily time points were controlled by the light/dark regimes in which the plants were grown. These data provide evidence that 24-h oscillations in [Ca2+]cyt encode information concerning daylength and light intensity, which are two major regulators of plant growth and development.


Figures

Figure 1.
Figure 1.
Imaging Circadian Oscillations of [Ca2+]cyt in Leaves and Cotyledons of Arabidopsis. (A) Bright-field (BF) and pseudocolored photon-counting image of aequorin luminescence (AL; [C]) of Arabidopsis seedlings expressing aequorin. (B) Aequorin luminescence of Arabidopsis seedlings in circadian free-run (LL) at a PFD of 110 μmol m−2 s−1. Seedlings were entrained to a 12L/12D photoperiod at 60 μmol m−2 s−1 PFD for 11 d before LL. Closed black circles represent the mean luminescence of 12 seedling clusters with standard error bars. Closed red circles represent the luminescence from a single seedling cluster. The numbers beside the points during the second circadian cycle indicate the number of hours into LL that each photon-counting image was acquired and correspond to the images presented in (C). The theoretical best-fit curve for FFT at 95% confidence probability is shown in blue. The bar above the abscissa indicates the subjective light regime during LL. Open areas (in the bar) represent subjective day, and hatched areas represent subjective night. The closed black area represents the final dark period before LL. (C) Pseudocolored photon-counting images of the luminescence emitted by a single cluster of Arabidopsis seedlings expressing aequorin. Numbers indicate the time in LL when each image was recorded. Cold colors (blue and green) represent regions of low luminescence counts, corresponding to low [Ca2+]cyt. Warm colors (yellow and orange) represent regions of more intense luminescence, indicating higher [Ca2+]cyt. The closed red circles in (B) represent the integrated luminescence emitted by this seedling cluster at the indicated times.
Figure 2.
Figure 2.
Light Intensity Modulates the Amplitude of Circadian Oscillations of [Ca2+]cyt. Points represent the mean luminescence from seedling clusters, with standard error bars shown. Seedlings were entrained to a 12L/12D photoperiod at 60 μmol m−2 s−1 for 11 d before transfer to LL at a PFD of 110 μmol m−2 s−1 (closed circles; n = 10) or 60 μmol m−2 s−1 (closed triangles; n = 8). Open areas indicate subjective day, and shaded areas indicate subjective night. The closed area represents the final dark period before LL.
Figure 3.
Figure 3.
Circadian Oscillations of [Ca2+]cyt in Arabidopsis Seedlings Entrained to Different Photoperiods. Aequorin luminescence emitted by seedlings in 110 μmol m−2 s−1 LL. Seedlings were entrained in 6L/18D (A), 8L/16D (B), 12L/12D (C), and 16L/8D (D) for 11 d before LL. During the entrainment light period, the PFD was 60 μmol m−2 s−1. Points represent the mean bioluminescence of 12 seedling clusters ±se. Open areas indicate the subjective day, and shaded areas indicate the subjective night. The closed area represents the final dark period of the entrainment.
Figure 4.
Figure 4.
Circadian Oscillations of [Ca2+]cyt Were Arrhythmic in Very Long Photoperiods. (A) Aequorin luminescence emitted by Arabidopsis seedlings entrained in 60 μmol m−2 s−1 16L/8D (open circles) or 20L/4D (closed squares) for 11 d before transfer to 110 μmol m−2 s−1 LL. Points represent the mean of 12 seedling clusters ±se. The period of the mean oscillation in aequorin bioluminescence was 26 h (relative amplitude error [Rel-Amp] = 0.31) for seedlings entrained in 16L/8D. However, no rhythmic component to the mean bioluminescence of seedlings entrained in 20L/4D was determined by FFT-NLLS. (B) Table showing the mean ± se of the period of bioluminescence for seedling clusters expressing aequorin in LL. The period of bioluminescence was calculated for each cluster using FFT-NLLS. Seedlings were entrained in the photoperiods indicated at 60 μmol m−2 s−1 for 11 d before transfer to 110 μmol m−2 s−1 LL.
Figure 5.
Figure 5.
The Photoperiod of Entrainment Shifts the Phase of Circadian Oscillations of [Ca2+]cyt in Constant Light. (A) Aequorin luminescence of Arabidopsis seedlings in 110 μmol m−2 s−1 LL. Seedlings were entrained in 6L/18D (dashed line) or in 16L/8D (solid line) at a PFD of 60 μmol m−2 s−1 for 11 d before LL. For clarity, the points representing the mean values do not appear. The thin, vertical lines that intersect the abscissa at 0, 24, 48, and 72 h indicate subjective dawn for all seedlings. (B) Timing of maximum aequorin luminescence, relative to subjective dawn, of Arabidopsis seedlings in LL, entrained to 6L/18D (open bars), 8L/16D (light-shaded bars), 12L/12D (dark-shaded bars), and 16L/8D (closed bars). Bars represent the mean luminescence of 24 to 36 seedling clusters, with standard errors shown. Circadian cycles are indicated below each set of bars: Cycle 2 corresponds to 24 to 48 h in LL, and cycle 3 corresponds to 48 to 72 h in LL. (C) Timing of minimum aequorin luminescence, relative to subjective dawn, emitted by Arabidopsis seedlings in LL, entrained to 6L/18D (open bars), 8L/16D (light-shaded bars), 12L/12D (dark-shaded bars), and 16L/8D (closed bars). As in (B), bars represent the mean luminescence of 24 to 36 seedling clusters, with standard errors and the circadian cycles indicated below each set of bars.
Figure 6.
Figure 6.
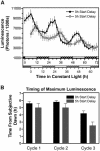
The Effect of the Dark Period Length on Circadian Oscillations of [Ca2+]cyt. (A) Aequorin luminescence of Arabidopsis seedlings in 110 μmol m−2 s−1 LL. Seedlings expressing apoaequorin were entrained in 60 μmol m−2 s−1 12L/12D for 11 d. Closed circles represent the mean luminescence with standard errors emitted by 10 seedling clusters that experienced the normal 12L/12D on day 11, before transfer to LL. Open circles represent the mean luminescence with standard errors emitted by four seedling clusters that received an additional 5 h of darkness before transfer to LL, hence a 12-h-light period followed by a 17-h-dark period on day 11. The bars on the abscissa indicate the subjective light regime during LL and are color-coded to match the graph. Open areas represent subjective day, hatched areas subjective night, and closed areas the final dark period before LL. For all seedlings, the time of transfer to LL is defined as the start (t = 0) of subjective dawn. (B) Timing from subjective dawn of maximum aequorin luminescence emitted by Arabidopsis seedlings entrained in 60 μmol m−2 s−1 12L/12D. Bars represent the mean luminescence emitted by seedling clusters ±se. Closed bars (n = 10) indicate that seedlings received a 12-h-dark period before transfer to LL, and shaded bars (n = 4) denote seedlings for which the transfer from darkness to LL was delayed by 5 h. As for (A), the time of transfer to LL is defined as the t = 0 of subjective dawn.
Figure 7.
Figure 7.
Light Intensity and Duration Modulates [Ca2+]cyt Oscillations in Light and Dark Cycles. (A) Oscillations of aequorin luminescence from Arabidopsis seedlings in LD. Seedlings expressing apoaequorin were grown in 60 μmol m−2 s−1 8L/16D (open circles, top graph), in 110 μmol m−2 s−1 8L/16D (open triangles, middle graph), or in 60 μmol m−2 s−1 16L/8D (closed circles, bottom graph) for 14 d. Points represent the mean of 12 seedling clusters ±se. Open areas represent the light periods, and shaded areas represent the dark periods experienced by the seedlings during bioluminescence imaging. (B) Timing from dawn of maximum aequorin luminescence emitted by Arabidopsis in 60 μmol m−2 s−1 8L/16D (closed bars), in 110 μmol m−2 s−1 8L/16D (shaded bars), or in 60 μmol m−2 s−1 16L/8D (open bars). Bars represent the mean luminescence of 12 seedling clusters ±se.

Similar articles

Cited by

References

    1. Alabadi, D., Oyama, T., Yanovsky, M.J., Harmon, F.G., Mas, P., and Kay, S.A. (2001). Reciprocal regulation between TOC1 and LHY/CCA1 within the Arabidopsis circadian clock. Science 293, 880–883. - PubMed
    1. Allen, G.J., Chu, S.P., Harrington, C.L., Schumacher, K., Hoffmann, T., Tang, Y.Y., Grill, E., and Schroeder, J.I. (2001). A defined range of guard cell calcium oscillation parameters encodes stomatal movements. Nature 411, 1053–1057. - PubMed
    1. Bakrim, N., Brulfert, J., Vidal, J., and Chollet, R. (2001). Phosphoenolpyruvate carboxylase kinase is controlled by a similar signaling cascade in CAM and C4 plants. Biochem. Biophys. Res. Commun. 286, 1158–1162. - PubMed
    1. Baum, G., Long, J.C., Jenkins, G.I., and Trewavas, A.J. (1999). Stimulation of the blue light phototropic receptor NPH1 causes a transient increase in cytosolic Ca2+. Proc. Natl. Acad. Sci. USA 96, 13554–13559. - PMC - PubMed
    1. Berridge, M.J., Lipp, P., and Bootman, M.D. (2000). The versatility and universality of calcium signalling. Nat. Rev. Mol. Cell Biol. 1, 11–21. - PubMed

Publication types

LinkOut - more resources