

Conformational stability and domain coupling in D-glucose/D-galactose-binding protein from Escherichia coli
- PMID: 15032747
- PMCID: PMC1133766
- DOI: 10.1042/BJ20040232
Conformational stability and domain coupling in D-glucose/D-galactose-binding protein from Escherichia coli
Abstract
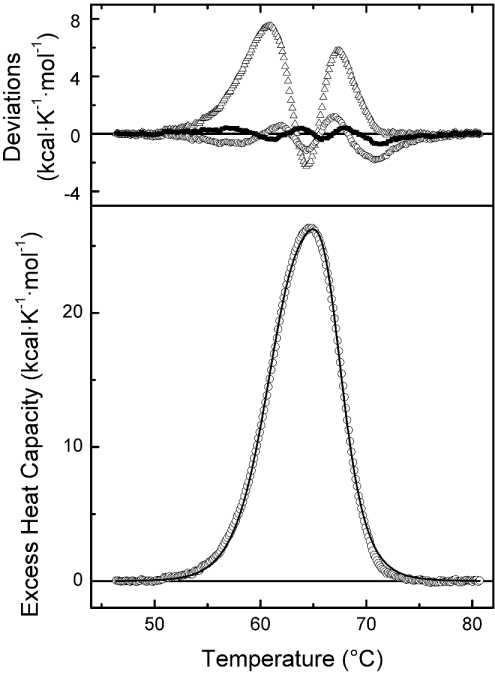
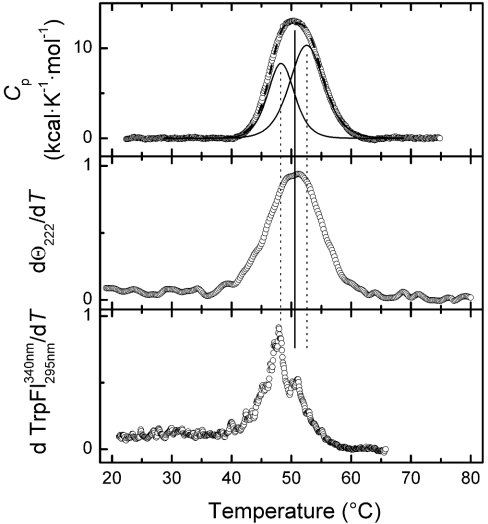
The monomeric D-glucose/D-galactose-binding protein (GGBP) from Escherichia coli (M(r) 33000) is a periplasmic protein that serves as a high-affinity receptor for the active transport and chemotaxis towards both sugars. The effect of D-glucose binding on the thermal unfolding of the GGBP protein at pH 7.0 has been measured by differential scanning calorimetry (DSC), far-UV CD and intrinsic tryptophanyl residue fluorescence (Trp fluorescence). All three techniques reveal reversible, thermal transitions and a midpoint temperature (T(m)) increase from 50 to 63 degrees C produced by 10 mM D-glucose. Both in the absence and presence of D-glucose a single asymmetric endotherm for GGBP is observed in DSC, although each endotherm consists of two transitions about 4 degrees C apart in T(m) values. In the absence of D-glucose, the protein unfolding is best described by two non-ideal transitions, suggesting the presence of unfolding intermediates. In the presence of D-glucose protein, unfolding is more co-operative than in the absence of the ligand, and the experimental data are best fitted to a model that assumes two ideal (two-state) sequential transitions. Thus D-glucose binding changes the character of the GGBP protein folding/unfolding by linking the two domains such that protein unfolding becomes a cooperative, two two-state process. A K(A)' value of 5.6x10(6) M(-1) at 63 degrees C for D-glucose binding is estimated from DSC results. The domain with the lower stability in DSC measurements has been identified as the C-terminal domain of GGBP from thermally induced Trp fluorescence changes.
Figures


Similar articles
-
The role of calcium in the conformational dynamics and thermal stability of the D-galactose/D-glucose-binding protein from Escherichia coli.Proteins. 2005 Oct 1;61(1):184-95. doi: 10.1002/prot.20582. Proteins. 2005. PMID: 16080150
-
Structure and Conformational Properties of d-Glucose/d-Galactose-Binding Protein in Crowded Milieu.Molecules. 2017 Feb 6;22(2):244. doi: 10.3390/molecules22020244. Molecules. 2017. PMID: 28178192 Free PMC article.
-
Unfolding free energy of a two-domain transmembrane sugar transport protein.Proc Natl Acad Sci U S A. 2010 Oct 26;107(43):18451-6. doi: 10.1073/pnas.1005729107. Epub 2010 Oct 11. Proc Natl Acad Sci U S A. 2010. PMID: 20937906 Free PMC article.
-
The role of water molecules in stereoselectivity of glucose/galactose-binding protein.Sci Rep. 2016 Nov 9;6:36807. doi: 10.1038/srep36807. Sci Rep. 2016. PMID: 27827455 Free PMC article.
-
An "Onion-like" Model of Protein Unfolding: Collective versus Site Specific Approaches.Chemphyschem. 2022 Jan 5;23(1):e202100520. doi: 10.1002/cphc.202100520. Epub 2021 Oct 13. Chemphyschem. 2022. PMID: 34549492 Review.
Cited by
-
Photophysical Properties of BADAN Revealed in the Study of GGBP Structural Transitions.Int J Mol Sci. 2021 Oct 15;22(20):11113. doi: 10.3390/ijms222011113. Int J Mol Sci. 2021. PMID: 34681772 Free PMC article.
-
The ABC transporter MsbA interacts with lipid A and amphipathic drugs at different sites.Biochem J. 2009 Apr 15;419(2):317-28. doi: 10.1042/BJ20081364. Biochem J. 2009. PMID: 19132955 Free PMC article.
-
Shedding light on the role of Vitreoscilla hemoglobin on cellular catabolic regulation by proteomic analysis.Int J Biol Sci. 2008 Mar 3;4(2):71-80. doi: 10.7150/ijbs.4.71. Int J Biol Sci. 2008. PMID: 18345284 Free PMC article.
-
Protein free energy landscapes remodeled by ligand binding.Biophys J. 2007 Jul 15;93(2):579-85. doi: 10.1529/biophysj.107.103911. Epub 2007 May 4. Biophys J. 2007. PMID: 17483166 Free PMC article.
-
Effect of glucose on the lactoferrin's conformation and its effect on MC 3T3-E1 cell proliferation.Protein J. 2012 Apr;31(4):300-5. doi: 10.1007/s10930-012-9406-9. Protein J. 2012. PMID: 22450829
References
-
- Epand R. F., Epand R. M., Jung C. Y. Glucose-induced thermal stabilization of the native conformation of GLUT 1. Biochemistry. 1999;38:454–458. - PubMed
-
- Catanzano F., Gambuti A., Graziano G., Barone G. Interaction with D-glucose and thermal denaturation of yeast hexokinase B: a DSC study. J. Biochem. (Tokyo) 1997;121:568–577. - PubMed
-
- Boos W., Lucht J. M. Periplasmic binding-protein-dependent ABC transports. In: Lin E., editor. E. coli and Salmonella typhimurium: Cellular and Molecular Biology. Washington, DC: American Society for Microbiology; 1995. pp. 1175–1209.
-
- Gestwicki J. E., Strong L. E., Borchardt S. L., Cairo C. W., Schnoes A. M., Kiessling L. L. Designed potent multivalent chemoattractants for Escherichia coli. Bioorgan. Med. Chem. 2001;9:2387–2393. - PubMed
-
- Quiocho F. A. Atomic structures and function of periplasmic receptors for active transport and chemotaxis. Curr. Opin. Biol. 1991;1:922–933.
Publication types
MeSH terms
Substances
LinkOut - more resources
Full Text Sources
Other Literature Sources
Molecular Biology Databases