

The distribution of mast cells in the human area postrema
- PMID: 15032921
- PMCID: PMC1571242
- DOI: 10.1111/j.1469-7580.2004.00256.x
The distribution of mast cells in the human area postrema
Abstract
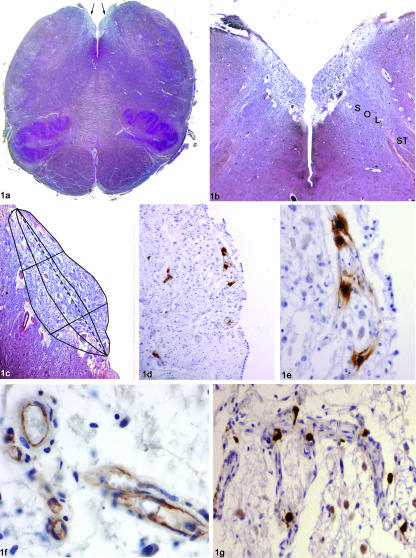
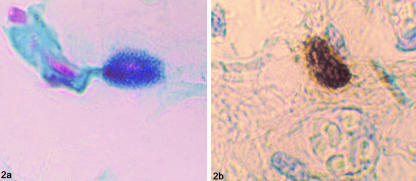
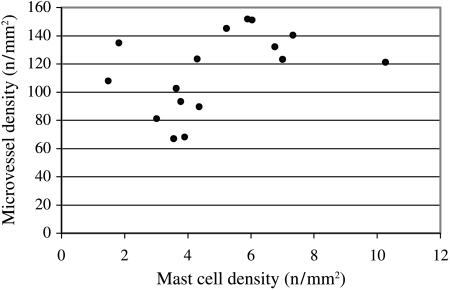
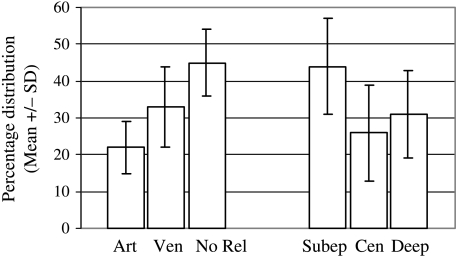
The topography and phenotype of mast cells in the human area postrema, together with correlation between mast-cell density and microvessel density (MVD), were analysed in 16 brains. Transverse serial sections of formalin-fixed, paraffin-embedded brainstems were stained with toluidine blue and alcian blue/safranin stainings, and with anti-tryptase and anti-CD31 monoclonal antibodies. The mean (+/- SD) numbers of mast cells per section were 1.3 +/- 0.8 and 1.2 +/- 0.7 with toluidine blue and alcian blue/safranin, respectively, whereas anti-tryptase monoclonal antibody showed a mean of 5.1 +/- 2.4 cells. Mast cells were alcian blue- and safranin-positive in 56%, because of the coexistence of low-sulphated (blue-staining) and high-sulphated (red-staining) granules. No significant linear correlation between mast-cell density (4.9 mm(-2)) and MVD (114.5 mm(-2)) was found (r(2) = 0.19, P = 0.09). Mast cells were frequently located close to blood vessels (55%) (33% to venules, 22% to arterioles), indicating that their products play a role in the regulation of blood flow and in vessel permeability in the area postrema. Mast cells were located subependymally in 44% and close to the dorsal aspect of the nucleus of the tractus solitarius in 31%, suggesting a subregional distribution.
Figures
References
-
- Allen MA, Smith PM, Ferguson AV. Adrenomedullin microinjection into the area postrema increases blood pressure. Am. J. Physiol. 1997;272:R1698–R1703. 10.1111/j.1469-7580.2004.00256.x. - DOI - PubMed
-
- Bhargava KP, Dixit KS, Palit G. Nature of histamine receptors in the emetic chemoreceptor trigger zone. Br. J. Pharmacol. 1976;57:211–213. 10.1111/j.1469-7580.2004.00256.x. - DOI - PMC - PubMed
-
- Boesiger J, Tsai M, Maurer M, Yamaguchi M, Brown LF, Claffey KP, et al. Mast cells can secrete vascular permeability factor/vascular endothelial cell growth factor and exhibit enhanced release after Immunoglobulin E-dependent upregulation of Fcɛ receptor I expression. J. Exp. Med. 1998;188:1135–1145. 10.1111/j.1469-7580.2004.00256.x. - DOI - PMC - PubMed
-
- Brizee KR, Klara PM. The structure of the mammalian area postrema. Fed. Proc. 1984;43:2944–2948. 10.1111/j.1469-7580.2004.00256.x. - DOI - PubMed
-
- Cai Y, Hay M, Bishop VS. Synaptic connections and interactions between area postrema and nucleus tractus solitarius. Brain Res. 1996;724:121–124. 10.1111/j.1469-7580.2004.00256.x. - DOI - PubMed
MeSH terms
Substances
LinkOut - more resources
Full Text Sources
