Review
. 2004 Mar 23;1662(1-2):42-60.
doi: 10.1016/j.bbamem.2004.01.008.

Gap junction channel gating

Affiliations
Review

Gap junction channel gating

Feliksas F Bukauskas et al. Biochim Biophys Acta. .

Abstract

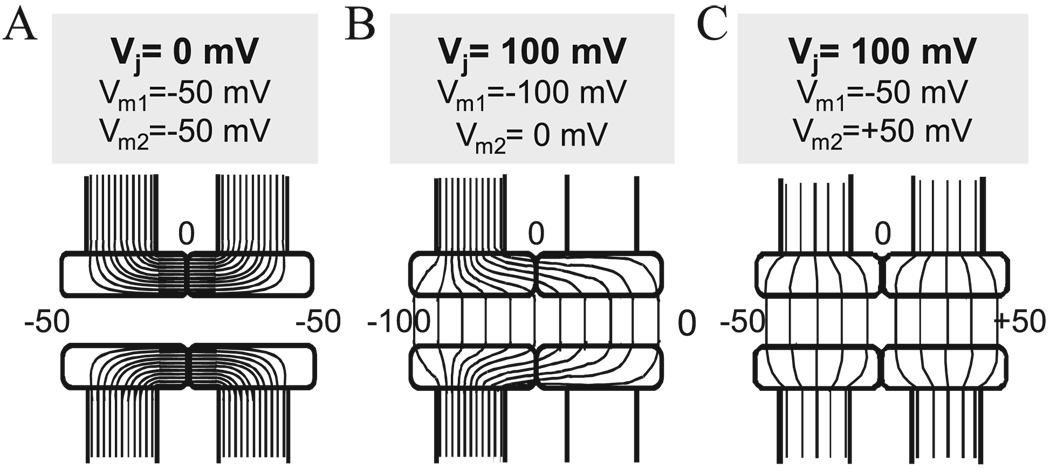
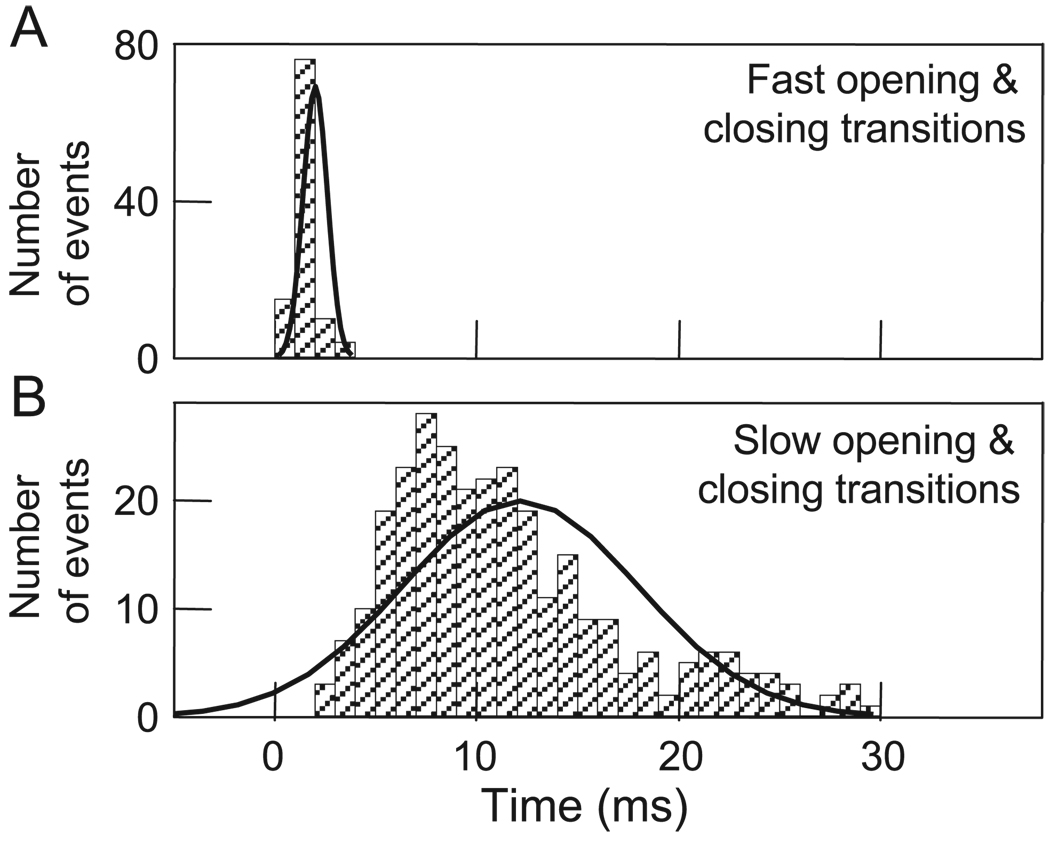
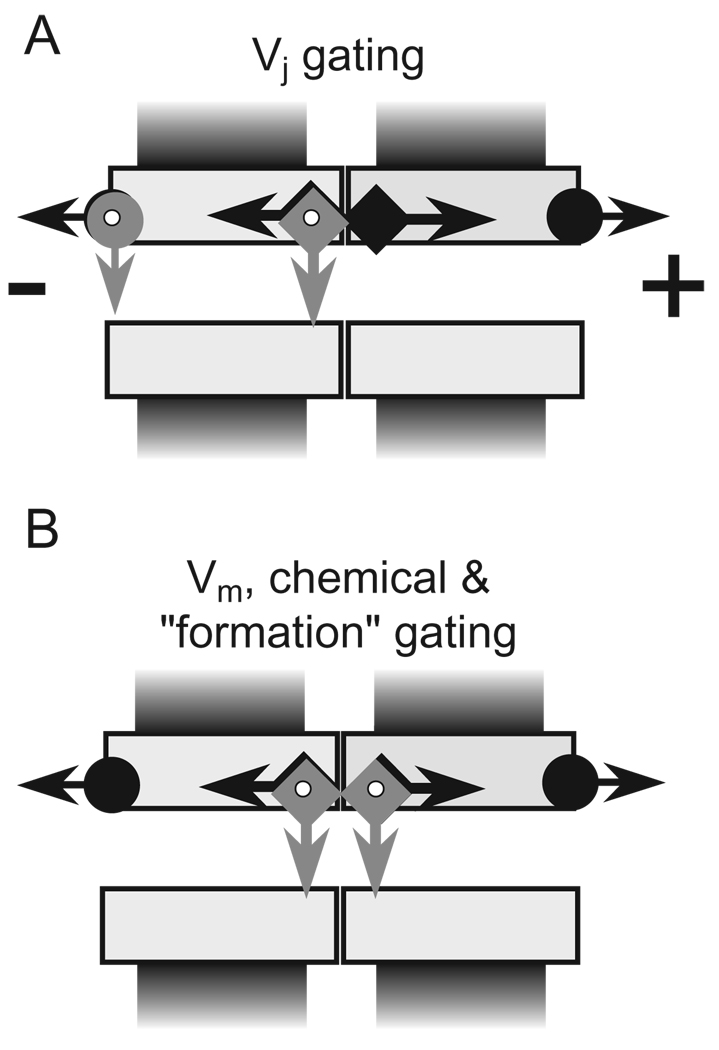
Over the last two decades, the view of gap junction (GJ) channel gating has changed from one with GJs having a single transjunctional voltage-sensitive (V(j)-sensitive) gating mechanism to one with each hemichannel of a formed GJ channel, as well as unapposed hemichannels, containing two, molecularly distinct gating mechanisms. These mechanisms are termed fast gating and slow or 'loop' gating. It appears that the fast gating mechanism is solely sensitive to V(j) and induces fast gating transitions between the open state and a particular substate, termed the residual conductance state. The slow gating mechanism is also sensitive to V(j), but there is evidence that this gate may mediate gating by transmembrane voltage (V(m)), intracellular Ca(2+) and pH, chemical uncouplers and GJ channel opening during de novo channel formation. A distinguishing feature of the slow gate is that the gating transitions appear to be slow, consisting of a series of transient substates en route to opening and closing. Published reports suggest that both sensorial and gating elements of the fast gating mechanism are formed by transmembrane and cytoplamic components of connexins among which the N terminus is most essential and which determines gating polarity. We propose that the gating element of the slow gating mechanism is located closer to the central region of the channel pore and serves as a 'common' gate linked to several sensing elements that are responsive to different factors and located in different regions of the channel.


Figures

Fig. 1
Fig. 1
Schematic representation of a GJ channel with presumed isopotential lines when both cells are held at the Vj = 0 mV (A), and at Vj = 100 mV (B & C) but at different values of Vm in each cell. In (A) the channel lumen is isopotential with cytoplasms of both cells; Vm1 = Vm2 = − 50 mV. This condition establishes a strong electric field (E) or a high density of isopotential lines across the channel wall in its central region. No Vj is established and E = 0 along the channel pore. GJ channels that respond to this voltage profile are termed Vm-sensitive. In (B), Vm1 differs from Vm2 establishing a Vj and a constant E along the pore; Vm changes along the channel pore from − 100 to 0 mV. In (C), the same Vj and profile of E along the channel pore are established as in (B), but with different values of Vm1 ( − 50 mV) and Vm2 (50 mV). GJ channels that respond the same way to voltage profiles in (B) and (C) are termed Vj-sensitive but not Vm-sensitive.
Fig. 2
Fig. 2
Voltage gating in HeLaCx43 and Novikoff cell pairs. (A) Pooled data of normalized gj vs. Vj measured in Novikoff (open circles) and HeLaCx43 (filled circles) cell pairs. The solid line is a fit of all the points to a Boltzmann relation with the following parameters: V0 = 51 mV, A = 0.08 mV− 1 and Gmin = 0.2 for negative Vjs and V0 = 50 mV, A = 0.09 mV− 1 and Gmin = 0.18 for positive Vjs. Squares filled with lines of different orientations indicate areas in which Vj gating is mediated predominantly through the slow gate (rising lines), the fast gate (declining lines) and both gates (crossing lines). (B) Schematic drawings of gj evaluated over time in response to Vj steps varying in amplitude from ~ 30 to 150 mV that exemplify our findings in cells expressing Cx43 (see Fig. 1 in Ref. [51]). When Vj steps are < 50 mV (see gj and Vj traces in 0–60-s interval), gj declines and recovers slowly. When Vjs are in the range of ~ 50–100mV(see gj and Vj traces in 50–150-s time interval), gj declines fast reaching steady state in few seconds. Recovery of gj is also fast. At Vj > 100 mV, the decline in gj is very fast initially and continues to decline more slowly without reaching steady state in the time interval shown (see gj and Vj traces in 150–220-s interval).
Fig. 3
Fig. 3
gjVj dependence of Cx43 at the single channel level. (A) Vj steps applied to individual cell pairs. (B–E) Ij responses to Vj steps of 37 mV (B), 69 mV (C), 75 mV (D) and 105 mV (E). With a Vj step of 37 mV (B), four channels open at the beginning of the step and two closing transitions occur between open and closed states of ~ 110 pS (arrows) during the duration of the step. Also evident are several brief transitions, ~ 85 pS in magnitude (asterisks) representing transitions to the residual conductance state (γres). An expanded time scale (inset; sampling interval 1 ms) shows that the ~ 110-pS transitions are slow, taking several milliseconds to fully close the channel. At Vj = 69 mV (C), Ij declines rapidly through stepwise transitions of 85 pS indicating that the decline in gj is via gating to γres. One channel undergoes a full 110-pS closing transition (first arrow). Also evident is a small 30-pS slow transition ascribable to a full closure of a channel from γres (second arrow; also see inset, sampling interval, 5 ms). At Vj = 75 mV (D), all the channels rapidly close to the residual state with transitions of 85 pS. At Vj = 107 mV (E), Ij declines very rapidly to a level that corresponds to all channels residing in γres and is followed by a slow decline in Ij through stepwise 30-pS transitions corresponding to full channel closures from γres. The expanded time scale (inset; sampling interval, 2 ms) shows the 30-pS transitions to be slow, taking several milliseconds to complete. Adapted from Ref. [51].
Fig. 4
Fig. 4
Frequency histograms of Ij transition time between open and residual states (A) and between open and closed states (B). Data were collected from fibroblasts and HeLa-43 cells at Vjs ranging from 25 to 75 mV during transient uncoupling by bath application of CO2. Solid lines are Gaussian curves that fit to the data with mean values of 11 ± 0.8 ms (n = 264) and 2.0 ± 0.2 ms (n = 105) for upper and bottom plots, respectively. Adapted from Ref. [50].
Fig. 5
Fig. 5
Voltage gating of wild-type Cx43 differs from that of Cx43-EGFP. (A –B) Single GJ channel gating transitions at Vj = 50 mV for Cx43 (left) and at Vj = 80 mV for Cx43-EGFP (right) expressed in HeLa cells. For Cx43, gating transitions are between open (solid line) and residual (dashed line) conductance states; full closures (not shown) occurred but were infrequent. For Cx43-EGFP, gating transitions are only between open and fully closed states. (C) Asymmetric Vj gating in heterotypic Cx43/Cx43-EGFP junctions. Shown are currents recorded from a cell pair containing two functional channels in response to a ± 100-mV ramp and ± 80-mV Vj steps applied to the HeLaCx43-EGFP cell. For the − 80-mV Vj step, only gating transitions of ~ 110 pS between open and closed states are observed, whereas for the + 80-mV Vj step, gating transitions of ~ 85 pS occur between open and residual states (dashed lines). Adapted from Ref. [51].
Fig. 6
Fig. 6
Cx43-EGFP channels are permeable to negatively (Alexa fluor(1 − ), Lucifer yellow(2 − ), APTS (3 − )) and positively (Ethidium bromide(+), DAPI(2+) and propidium iodide(2+)) charged dyes. In all examples shown, the HelaCx43-EGFP cell pairs demonstrated at least one junctional plaque in the region of cell–cell contact. In all cases, the cell designated as cell 1 was patched with pipette containing dye. Images were recorded ~ 10 min after establishing a whole cell recording in cell 1. After allowing ~ 10 min for dye transfer, electrical cell–cell coupling was evaluated by establishing a whole-cell recording in cell 2 with the second pipette. All the cell pairs shown responded to heptanol (2 mM) treatment with uncoupling, which indicates that GJs and not cytoplasmic bridges were responsible for the dye transfer.
Fig. 7
Fig. 7
Intercellular transfer of Alexa Fluor, a negatively charged dye, is restricted when channels are in the residual state. (A and B) Phase-contrast (A) and fluorescence (B) images showing a Novikoff cell pair in which dye transfer and electrical coupling were examined in open and residual states. Locations of pipettes 1 and 2 used for dual whole-cell recording and pipette 3 used for loading cell 1 with dye are indicated. RI-1, RI-2, and RI-3 are regions of interest from which fluorescence intensities were measured over time. Fluorescence intensities in the cells (RI-1 and RI-2) were calculated by subtracting the background fluorescence (RI-3). (C) Plot of normalized fluorescence intensity (FI) in cell 1 and cell 2 over time. A Vj of + 90 mV was imposed causing a decline in Ij to the residual conductance. Opening the patch in pipette 3 at steady state of gj (see solid arrow) causes FI in cell 1 to rise. FI in cell 2 shows no change during the time when channels mainly reside in the residual state. Upon reopening channels by removal of Vj (see dashed arrow), FI begins to rise immediately in cell 2 and reaches ~ 14% of the maximum within 60 s. Imposition of Vj a second time caused an immediate decline in FI in cell 2 due to loss of transfer from cell 1 and dialysis with patch pipette 2. (D) Records of Ij and V2 over time corresponding to fluorescence plot in (C). The Vj of + 90 mV imposed by stepping the voltage in cell 2 caused gj to decline from 43 nS to a steady-state value of ~ 10 nS. Between the + 90-mV Vj steps, small repeated ± 10-mV Vj steps were applied to cell 2 to measure gj. Ij recovered rapidly upon removal of the Vj step, indicating that mainly the fast gate was operating. Adapted from Ref. [62].
Fig. 8
Fig. 8
Cx32-CFP and Cx43-EGFP form heterotypic junctions visible as large junctional plaques. (A) A phase-contrast image of HeLa cells expressing Cx43-EGFP (on top of white line) and Cx32-CFP (below white line). (B) A color overlay of fluorescence images of HeLaCx32-CFP shown in green and HeLaCx43-EGFP cells shown in red. The arrows indicate heterotypic junctional plaques (yellow regions).
Fig. 9
Fig. 9
Asymmetric Vj gating in heterotypic Cx45/Cx43-EGFP junctions. (A) Pooled data of normalized steady-state gj ( Gj) vs. Vj measured in 15 homotypic HeLaCx45 cell pairs. The solid line is a fit of all of the data points to a contingent gating model containing one gate per hemichannel with parameters A = 0.3 mV− 1 and Vo = 8.9 mV for negative Vj, and A = 0.17 mV− 1 and Vo = 7.5 mV [76]. The value of gj reaches a minimum at ± 60 mV and then increases at higher Vjs (inset; the solid line is a regression line of the first order). (B) Normalized gjVj relation of a Cx45/Cx43-EGFP heterotypic junction. Data were pooled from 14 cell pairs. The thin black line is a fit of all data points to a four-state contingent gating model with one gate in each hemichannel (open and dotted circles). The parameters are A = 0.18 mV− 1 and Vo = 1 mV for the Cx45 hemichannel and A = 0.03 mV− 1 and Vo = 26 mV for the Cx43-EGFP hemichannel. The thick gray line is a fit of the data points indicated by dotted circles to a four-state contingent gating model of the channel containing fast and slow gates only in the Cx45 hemichannel. The parameters are A = 0.27 mV− 1 and Vo = 3 mV for the slow gate and A = 0.46 mV− 1 and Vo = 10 mV for the fast gate. An expanded view (inset) demonstrates that the contingent model can explain the secondary increase in gj at large Vjs [76]. (C) Example of opening of Cx45/Cx43-EGFP channels during a Vj step of − 60 mV applied to the Cx43-EGFP cell. Gating transitions are slow and between open and closed states. During a subsequent Vj step of + 60 mV, channels close completely with a short latency. (D) During Vj steps of 90 mV negative on Cx43-EGFP side, Cx45/Cx43-EGFP channels gate between the open state with a conductance of ~ 55 pS and the fully closed state. During positive Vj steps, the channel gates to the residual state (see arrow and dashed line) or to the closed state (second and third positive steps). (E) An example of asymmetric Vj gating in a Schwann/Fibroblast cell pair in response to Vj steps of ± 50 mV. Adapted from Ref. [76].
Fig. 10
Fig. 10
Asymmetry of electrical coupling mediated by heterotypic Cx45/Cx43-EGFP junctions. (A) The HeLaCx43-EGFP cell (V1) was voltage-clamped to positive or negative 100-mV, 30-ms rectangular pulses at 3 Hz from a holding potential of 0 mV. The HeLaCx45 cell (V2) was current-clamped, and the steady-state holding potential was varied from ~ 5 mV (0–20 s) to ~ − 8 mV (20–62 s). Electrical coupling was much greater for negative pulses and coupling asymmetry increased by making the Cx45 side more negative. (B) Schematic of a cell pair; voltage steps were applied to HelaCx43-EGFP cell. (C) Pooled data of the electrical coupling asymmetry coefficient, Kasym, vs. ΔVjh measured in seven Cx45/Cx43-EGFP cell pairs. Filled and open circles correspond to experiments in which the Cx43-EGFP or Cx45 cell was voltage-clamped and stepped, respectively. Solid line shows data fit to sigmoid function, Kasym = A/(1 + exp(bVjh − ΔVjho))), with parameters A = 0.9338, b = 0.24 mV− 1, ΔVjho =− 6.4 mV. Adapted from Ref. [76].
Fig. 11
Fig. 11
Vm and chemical gating in C6/9 cell pairs. (A) Shown is an example of Vm gating. Both cells were clamped to the same Vm ( − 35 mV) and a test pulse of 15 mV was applied repeatedly (1 Hz) to cell 2 to assay Ij (upward deflections in current record of cell 1, I1). A hyperpolarizing step of − 50 mV has no effect on Ij, while the depolarizing step of + 80 mV produces a reversible decrease in gj down to ~ 0. (B) Summarized gjVj plot (normalized) measured in eight cell pairs. The continuous curve is a fit of the data to the Boltzmann equation. (C) Example of Vm dependence of gj at the single channel level. Shown are Ij records obtained by using the double whole cell patch clamp method. Vm was imposed by applying equal and simultaneous polarizations to both cells. Vj was held constant throughout at − 15 mV. At Vms in cell 1 of − 60, − 35 and − 10 mV, the channel gates between γopen, indicated by level O, and γres (dashed line, R). Depolarization from − 60 to − 10 mV decreases the relative time spent in γopen. Further depolarization to + 15 mV causes the channel to close, indicated by level C. At + 60 mV the channel resides only in closed state. The transition to closed state has an apparently slow time course and is ascribed to Vm gating. Transitions between γopen and γres are rapid and are ascribed to Vj gating. (D–E) Effect of heptanol on the gjVm relationship. (D) Exposure to 1 mM heptanol leads to a gradual decline in Ij. A conditioning pulse from − 35 to − 85 mV increases Ij, while a conditioning pulse to − 10 mV led to complete uncoupling. (E) Time course of gjVm dependencies measured at different time intervals of C6/36 cell pair treatment with heptanol. Vm gating was measured under control perfusion (open circles) and 2 – 3 (filled circles), 3 – 4 (filled squares) and 4 – 5 min (filled triangles) under heptanol perfusion. Washout from heptanol returns the gjVm curve close to that obtained under control conditions. Adapted from [46,52].
Fig. 12
Fig. 12
Rapid effect of pH-induced closure in hemichannels indicates direct action of H+ on connexins. (A) An inside-out patch containing a single Cx46 hemichannel was subjected to repeated applications of pH 6.0 (region within the rectangle). Membrane potential was held at − 30 mV; hemichannel openings are downward deflections in current. Summation of similar currents from >100 traces obtained from a total of five separate patches shows no measurable delay between pH 6.0 application and the decrease in current. (B) Ensemble currents show a second effect of pH that is sensitive to the duration of acidification. Ensemble currents from multiple patches were normalized to the average prior to acidification. Recovery from 1- and 2-s applications was nearly 100%, whereas recovery from 5-s applications was only ~ 80%. Longer exposures further reduced degree of recovery. The same phenomenon was observed in cell–cell channels. Adapted from Ref. [95].
Fig. 13
Fig. 13
Schematics of a Cx43 gap junction channel containing fast (arrow with circle) and slow (arrow with square) gates. (A) Vj initiates gating mediated by both fast and slow gating mechanisms. (B) Vm and chemical uncouplers initiate gating mediated by the slow gating mechanism in both hemichannels. Gating transitions measured during the first channel opening during de novo channel formation are also slow and stepwise resembling gating transitions induced by Vm and chemical uncouplers.

References

    1. Bennett MV. Connexins in disease [news] Nature. 1994;368:18–19. - PubMed
    1. Elfgang C, Eckert R, Lichtenberg-Frate H, Butterweck A, Traub O, Klein RA, Hulser DF, Willecke K. Specific permeability and selective formation of gap junction channels in connexin-transfected HeLa cells. J. Cell Biol. 1995;129:805–817. - PMC - PubMed
    1. Goodenough DA, Goliger JA, Paul DL. Connexins, connexons, and intercellular communication. Annu. Rev. Biochem. 1996;65:475–502. - PubMed
    1. Paul DL. Molecular cloning of cDNA for rat liver gap junction protein. J. Cell Biol. 1986;103:123–134. - PMC - PubMed
    1. Hertzberg EL, Disher RM, Tiller AA, Zhou Y, Cook RG. Topology of the Mr 27,000 liver gap junction protein. Cytoplasmic localization of amino- and carboxyl termini and a hydrophilic domain which is protease-hypersensitive. J. Biol. Chem. 1988;263:19105–19111. - PubMed

Publication types