

Extremely low birth weight and body size in early adulthood
- PMID: 15033844
- PMCID: PMC1719869
- DOI: 10.1136/adc.2002.025924
Extremely low birth weight and body size in early adulthood
Abstract
Aims: To determine the body size of extremely low birth weight (ELBW, birth weight 500-999 g) subjects in early adulthood.
Methods: Cohort study examining the height and weight of 42 ELBW survivors free of cerebral palsy between birth and 20 years of age. Weight and height measurements were converted to Z (SD) scores.
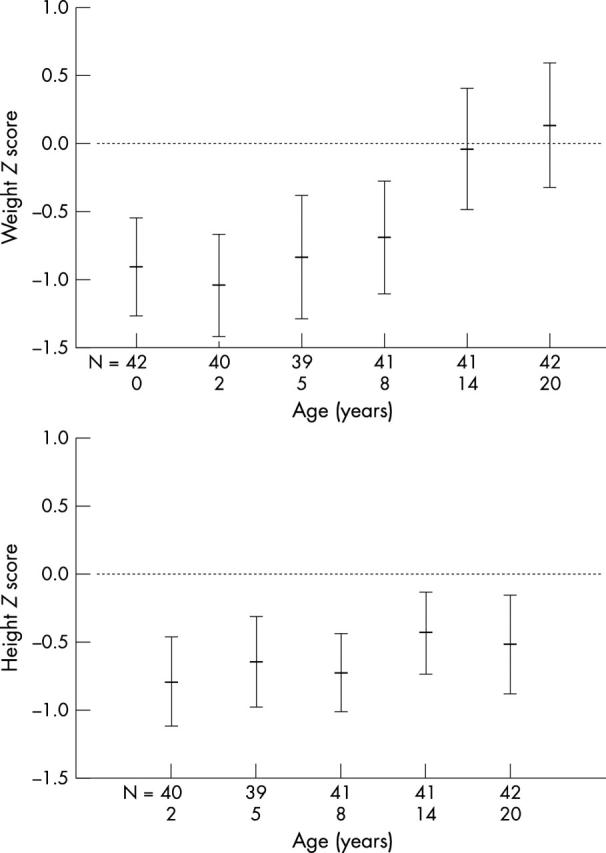
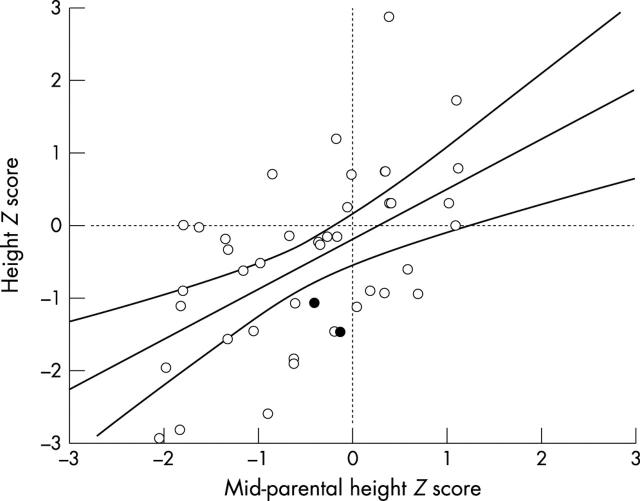
Results: At birth the subjects had weight Z scores substantially below zero (mean birth weight Z score -0.90, 95% CI -1.25 to -0.54), and had been lighter than average at ages 2, 5, and 8 years. However, by 14, and again at 20 years of age their weight Z scores were not significantly different from zero. At ages 2, 5, 8, 14, and 20 years of age their height Z scores were significantly below zero. Their height at 20 years of age was, however, consistent with their parents' height. As a group they were relatively heavy for their height and their mean body mass index (BMI) Z score was almost significantly different from zero (mean difference 0.42, 95% CI -0.02 to 0.84). Their mean BMI (kg/m2) was 24.0 (SD 5.2); 14 had a BMI >25, and four had a BMI >30.
Conclusions: Despite their early small size, by early adulthood the ELBW subjects had attained an average weight, and their height was consistent with their parents' height. They were, however, relatively heavy for their height.
Figures
References
Publication types
MeSH terms
LinkOut - more resources
Full Text Sources
Research Materials