

Calculating the statistical significance of physical clusters of co-regulated genes in the genome: the role of chromatin in domain-wide gene regulation
- PMID: 15034148
- PMCID: PMC390345
- DOI: 10.1093/nar/gkh507
Calculating the statistical significance of physical clusters of co-regulated genes in the genome: the role of chromatin in domain-wide gene regulation
Abstract
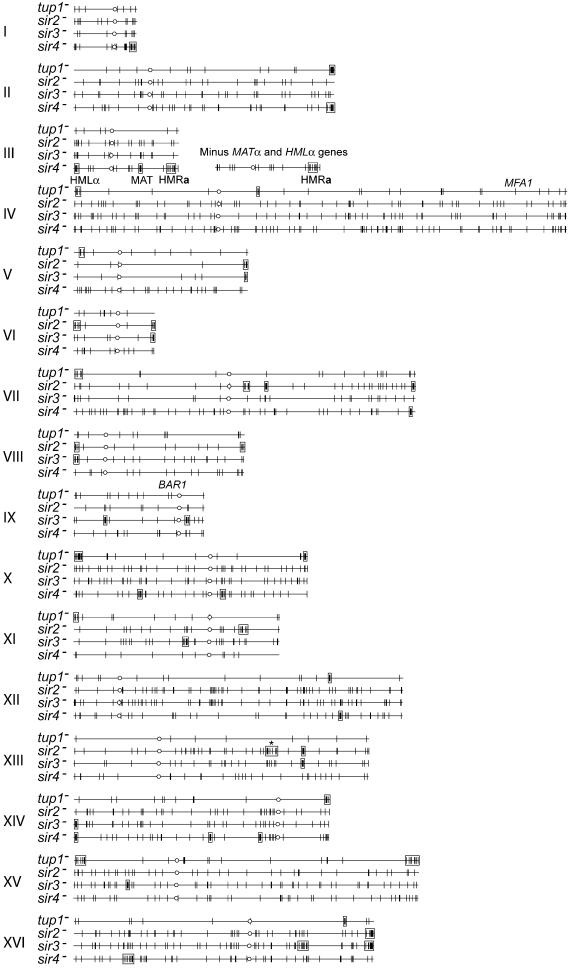
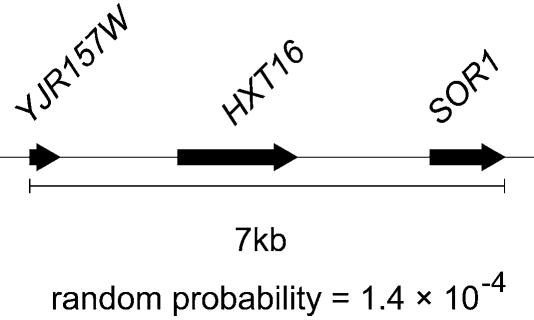
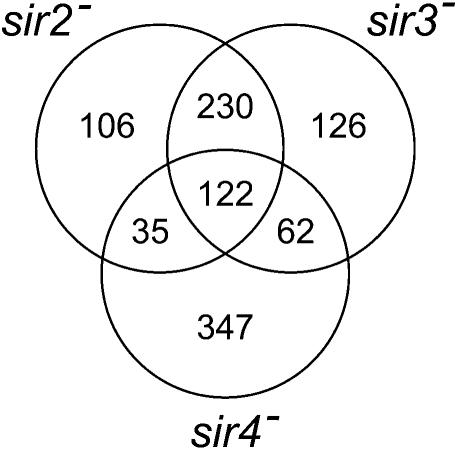
Physical clusters of co-regulated, but apparently functionally unrelated, genes are present in many genomes. Despite the important implication that the genomic environment contributes appreciably to the regulation of gene expression, no simple statistical method has been described to identify physical clusters of co-regulated genes. Here we report the development of a model that allows the direct calculation of the significance of such clusters. We have implemented the derived statistical relation in a software program, Pyxis, and have analyzed a selection of Saccharomyces cerevisiae gene expression microarray data sets. We have identified many gene clusters where constituent genes exhibited a regulatory dependence on proteins previously implicated in chromatin structure. Specifically, we found that Tup1p-dependent gene domains were enriched close to telomeres, which suggested a new role for Tup1p in telomere silencing. In addition, we identified Sir2p-, Sir3p- and Sir4p-dependent clusters, which suggested the presence of Sir-mediated heterochromatin in previously unidentified regions of the yeast genome. We also showed the presence of Sir4p-dependent gene clusters bordering the HMRa heterothallic locus, which suggested leaky termination of the heterochromatin by the boundary elements. These results demonstrate the utility of Pyxis in identifying possible higher order genomic features that may contribute to gene regulation in extended domains.
Figures
Similar articles
-
Structural analyses of Sum1-1p-dependent transcriptionally silent chromatin in Saccharomyces cerevisiae.J Mol Biol. 2006 Mar 10;356(5):1082-92. doi: 10.1016/j.jmb.2005.11.089. Epub 2005 Dec 20. J Mol Biol. 2006. PMID: 16406069
-
Locus specificity determinants in the multifunctional yeast silencing protein Sir2.EMBO J. 2000 Jun 1;19(11):2641-51. doi: 10.1093/emboj/19.11.2641. EMBO J. 2000. PMID: 10835361 Free PMC article.
-
Regulation of transcriptional silencing in yeast by growth temperature.J Mol Biol. 2004 Dec 3;344(4):893-905. doi: 10.1016/j.jmb.2004.10.002. J Mol Biol. 2004. PMID: 15544800
-
A model for step-wise assembly of heterochromatin in yeast.Novartis Found Symp. 2004;259:48-56; discussion 56-62, 163-9. Novartis Found Symp. 2004. PMID: 15171246 Review.
-
To fire or not to fire: origin activation in Saccharomyces cerevisiae ribosomal DNA.Genes Dev. 2002 Oct 1;16(19):2459-64. doi: 10.1101/gad.1033702. Genes Dev. 2002. PMID: 12368256 Review. No abstract available.
Cited by
-
Genome-wide analysis of transcriptional dependence and probable target sites for Abf1 and Rap1 in Saccharomyces cerevisiae.Nucleic Acids Res. 2007;35(1):193-202. doi: 10.1093/nar/gkl1059. Epub 2006 Dec 7. Nucleic Acids Res. 2007. PMID: 17158163 Free PMC article.
-
Non-linear mapping for exploratory data analysis in functional genomics.BMC Bioinformatics. 2005 Jan 20;6:13. doi: 10.1186/1471-2105-6-13. BMC Bioinformatics. 2005. PMID: 15661072 Free PMC article.
-
Genome-wide, as opposed to local, antisilencing is mediated redundantly by the euchromatic factors Set1 and H2A.Z.Proc Natl Acad Sci U S A. 2007 Oct 16;104(42):16609-14. doi: 10.1073/pnas.0700914104. Epub 2007 Oct 9. Proc Natl Acad Sci U S A. 2007. PMID: 17925448 Free PMC article.
-
Comparative transcriptional profiling of two contrasting rice genotypes under salinity stress during the vegetative growth stage.Plant Physiol. 2005 Oct;139(2):822-35. doi: 10.1104/pp.105.065961. Epub 2005 Sep 23. Plant Physiol. 2005. PMID: 16183841 Free PMC article.
-
REEF: searching REgionally Enriched Features in genomes.BMC Bioinformatics. 2006 Oct 16;7:453. doi: 10.1186/1471-2105-7-453. BMC Bioinformatics. 2006. PMID: 17042935 Free PMC article.
References
-
- Cohen B.A., Mitra,R.D., Hughes,J.D. and Church,G.M. (2000) A computational analysis of whole-genome expression data reveals chromosomal domains of gene expression. Nature Genet., 26, 183–186. - PubMed
-
- de Haan G., Bystrykh,L.V., Weersing,E., Dontje,B., Geiger,H., Ivanova,N., Lemischka,I.R., Vellenga,E. and Van Zant,G. (2002) A genetic and genomic analysis identifies a cluster of genes associated with hematopoietic cell turnover. Blood, 100, 2056–2062. - PubMed
-
- Roy P.J., Stuart,J.M., Lund,J. and Kim,S.K. (2002) Chromosomal clustering of muscle-expressed genes in Caenorhabditis elegans. Nature, 418, 975–979. - PubMed
Publication types
MeSH terms
Substances
LinkOut - more resources
Full Text Sources
Molecular Biology Databases
