. 2004 Apr;10(4):422-8.
doi: 10.1038/nm1011. Epub 2004 Mar 14.

Noninvasive electrocardiographic imaging for cardiac electrophysiology and arrhythmia

Affiliations

Noninvasive electrocardiographic imaging for cardiac electrophysiology and arrhythmia

Charulatha Ramanathan et al. Nat Med. 2004 Apr.

Abstract

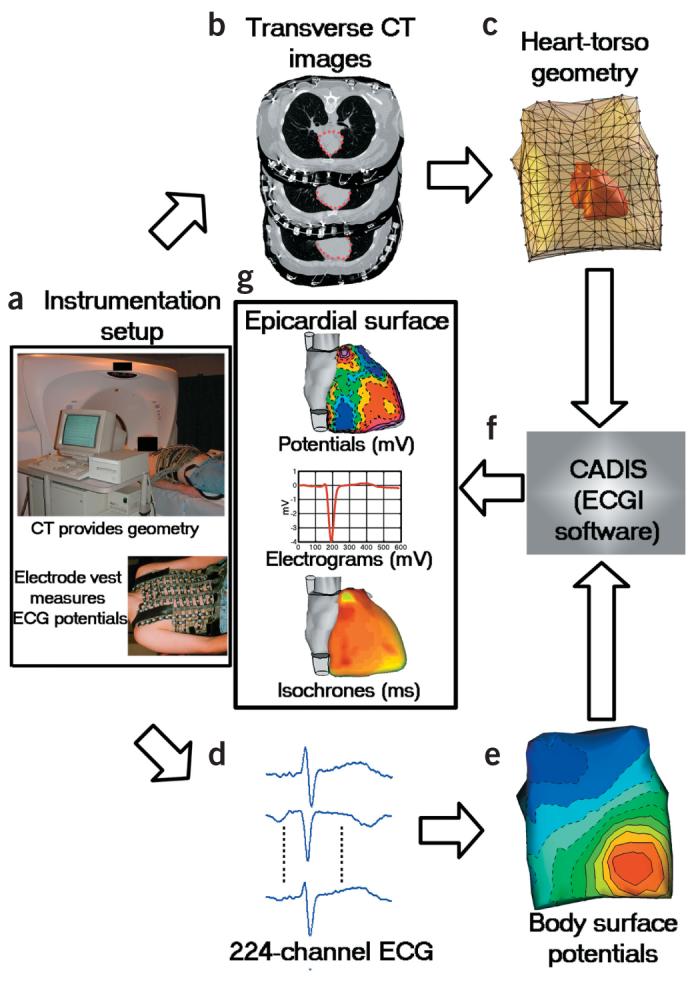
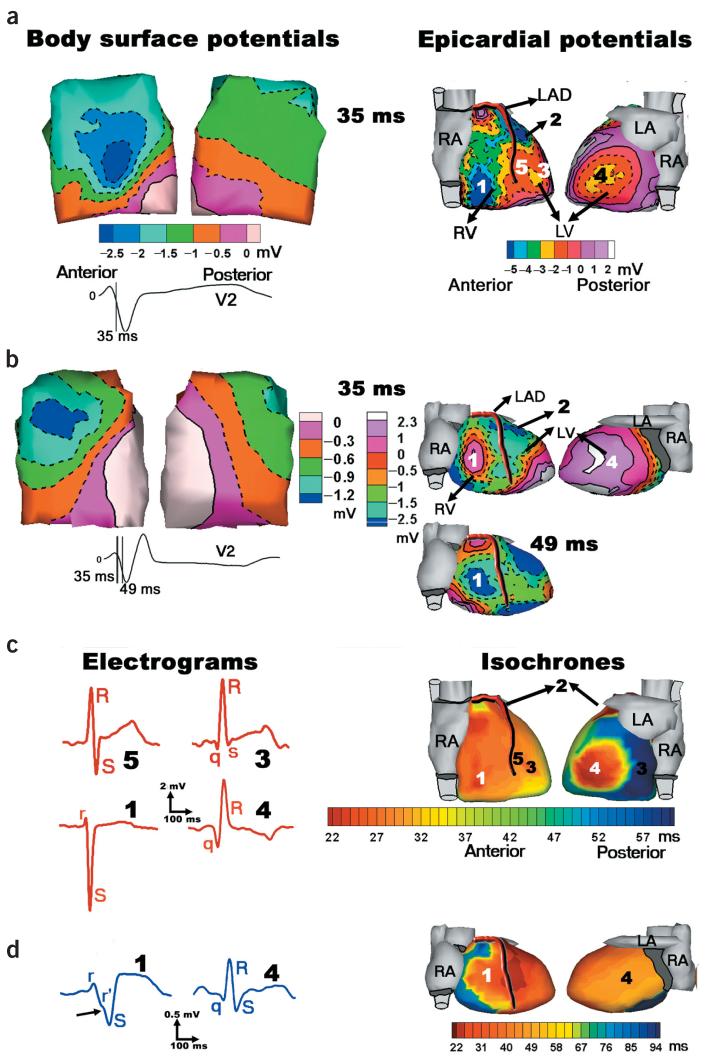
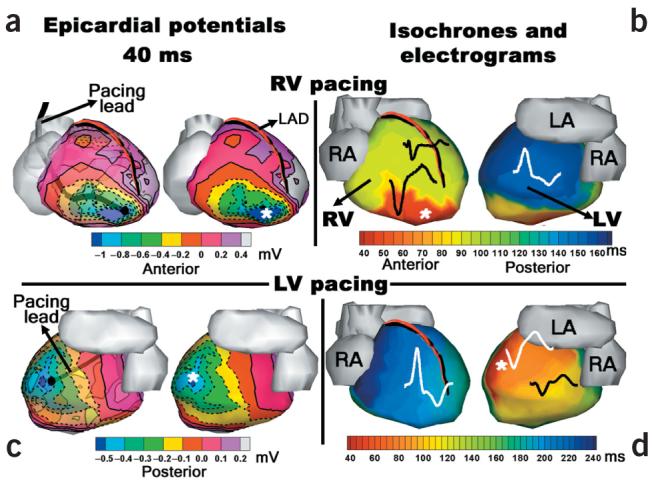
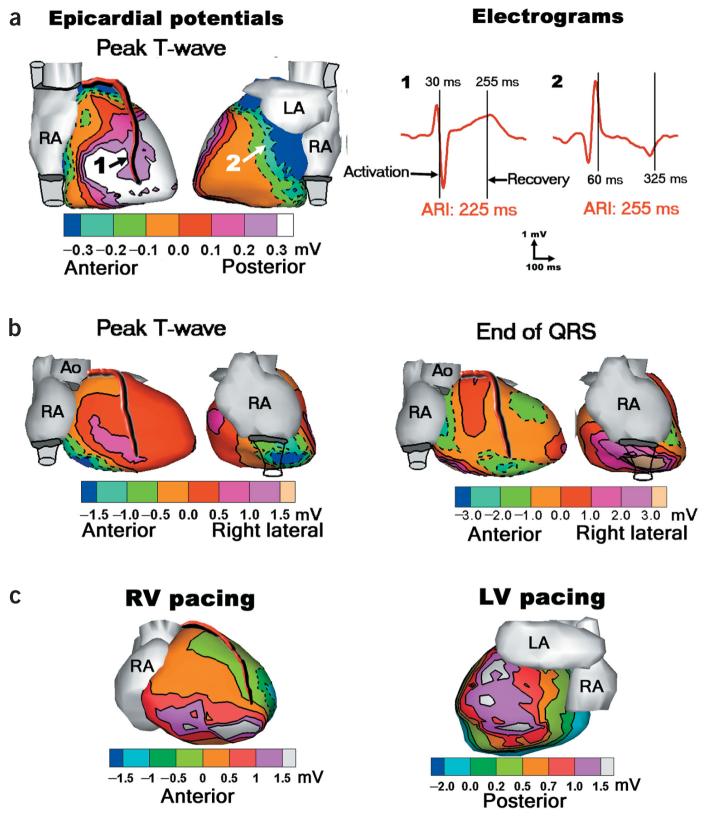
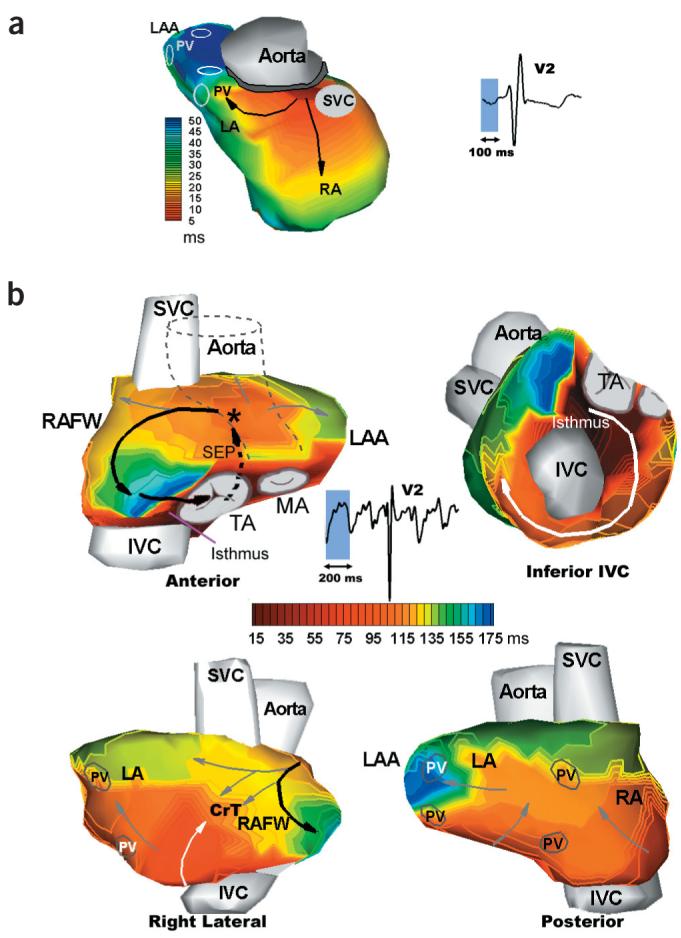
Over 7 million people worldwide die annually from erratic heart rhythms (cardiac arrhythmias), and many more are disabled. Yet there is no imaging modality to identify patients at risk, provide accurate diagnosis and guide therapy. Standard diagnostic techniques such as the electrocardiogram (ECG) provide only low-resolution projections of cardiac electrical activity on the body surface. Here we demonstrate the successful application in humans of a new imaging modality called electrocardiographic imaging (ECGI), which noninvasively images cardiac electrical activity in the heart. In ECGI, a multielectrode vest records 224 body-surface electrocardiograms; electrical potentials, electrograms and isochrones are then reconstructed on the heart's surface using geometrical information from computed tomography (CT) and a mathematical algorithm. We provide examples of ECGI application during atrial and ventricular activation and ventricular repolarization in (i) normal heart (ii) heart with a conduction disorder (right bundle branch block) (iii) focal activation initiated by right or left ventricular pacing, and (iv) atrial flutter.


Figures

Figure 1
Figure 1
Block diagram of the ECGI procedure. (a) Photographs of instrumentation setup. (b) CT transverse slices showing heart contours (red) and body-surface electrodes (shiny dots). (c) Meshed heart-torso geometry. (d) Sample ECG signals obtained from mapping system. (e) Spatial representation of BSPM. (f) ECGI software package (CADIS). (g) Examples of noninvasive ECGI images, including epicardial potentials, electrograms and isochrones.
Figure 2
Figure 2
Ventricular activation of subjects N and R. (a) Left, anterior and posterior views of BSPM for subject N, 35 ms after QRS onset. Lead V2 of standard ECG is shown for timing purposes. Right, noninvasive epicardial potential map reconstructed from BSPM at left. LAD, left anterior descending coronary artery; LA, left atrium; RA, right atrium. (b) Left, BSPM for subject R at 35 ms. Top right, noninvasive epicardial potential map reconstructed from BSPM at left. Bottom right, later noninvasive epicardial potential map (49 ms) showing delayed RV breakthrough (location 1). (c) Left, epicardial electrograms for subject N, from locations 1, 5, 3 and 4 (shown in a, right). Right, epicardial isochrones. 1, 2, 3 and 4 indicate locations of early epicardial activation (breakthrough sites). (d) Left, electrograms for subject R, from locations 1 and 4 (shown in b, top right). Right, epicardial isochrone map.
Figure 3
Figure 3
Ventricular activation in subject P during RV (top) and LV (bottom) pacing. (a) Anterior views of epicardial potential map during RV pacing. Left, translucent view showing pacing lead. Right, opaque view showing minimum at pacing site location (*). Anterior view is tilted 10° to show pacing site location on inferior RV apex. (b) Anterior and posterior views of epicardial isochrone map for RV pacing. Electrograms from three locations are shown at their respective spatial locations. (c) Posterior views of epicardial potential map during LV pacing (same format as in a). (d) Epicardial isochrone map with electrograms for LV pacing (same format as in b). LAD, left anterior descending coronary artery; LA, left atrium; RA, right atrium.
Figure 4
Figure 4
Ventricular repolarization in subjects N, R and P. (a) Left, anterior and posterior views of epicardial potential maps during peak T-wave in subject N. Right, electrograms from locations 1 and 2 (marked in a). Vertical lines mark local activation and recovery times relative to QRS onset. ARI, local activation recovery interval (difference between activation and recovery times). (b) Anterior and right lateral views of epicardial potential maps during peak T-wave (left) and end of QRS (right) in subject R. (c) Left, anterior view of epicardial potential map during peak T-wave for RV pacing in subject P. Right, posterior view of epicardial potential map during peak T-wave for LV pacing. Ao, aorta; LA, left atrium; RA, right atrium.
Figure 5
Figure 5
Atrial activation. (a) Normal isochrones for subject R. Left, superior-posterior view. Right, lead V2 of ECG, with P-wave shaded in light blue. (b) Isochrones during atrial flutter in subject AFL. Four views are shown. ECG lead V2 is shown, with imaged flutter cycle shaded blue. Black arrows in anterior view indicate the reentrant circuit beginning from isthmus, entering septum, emerging from Bachman bundle and propagating down right atrial free-wall (RAFW) to reenter isthmus again (a segment of the circuit is also indicated in right lateral view by black arrow). Solid arrows indicate epicardial activation; dashed arrow indicates septal activation. * indicates breakthrough at Bachman bundle. White arrows indicate wavefront propagation around IVC (inferior IVC view) and up RAFW (right lateral view). Activation of LA is shown by gray arrows in anterior and posterior views. LAA, left atrial appendage; SVC, superior vena cava; TA, tricuspid annulus; MA, mitral annulus; PV, pulmonary vein; SEP, septum; CrT, crista terminalis.

References

    1. Rudy Y, Burnes JE. Noninvasive electrocardiographic imaging. Ann. Noninvasive Electrocardiol. 1999;4:340–358.
    1. Oster HS, Taccardi B, Lux RL, Ershler PR, Rudy Y. Noninvasive electrocardiographic imaging: reconstruction of epicardial potentials, electrograms, and isochrones and localization of single and multiple electrocardiac events. Circulation. 1997;96:1012–1024. - PubMed
    1. Oster HS, Taccardi B, Lux RL, Ershler PR, Rudy Y. Electrocardiographic imaging: Noninvasive characterization of intramural myocardial activation from inverse-reconstructed epicardial potentials and electrograms. Circulation. 1998;97:1496–1507. - PubMed
    1. Burnes JE, Taccardi B, MacLeod RS, Rudy Y. Noninvasive ECG imaging of electrophysiologically abnormal substrates in infarcted hearts: a model study. Circulation. 2000;101:533–540. - PubMed
    1. Burnes JE, Taccardi B, Rudy Y. A noninvasive imaging modality for cardiac arrhythmias. Circulation. 2000;102:2152–2158. - PMC - PubMed

Publication types

MeSH terms