

Spatial correlations of mapped malaria rates with environmental factors in Belize, Central America
- PMID: 15035669
- PMCID: PMC406417
- DOI: 10.1186/1476-072X-3-6
Spatial correlations of mapped malaria rates with environmental factors in Belize, Central America
Abstract
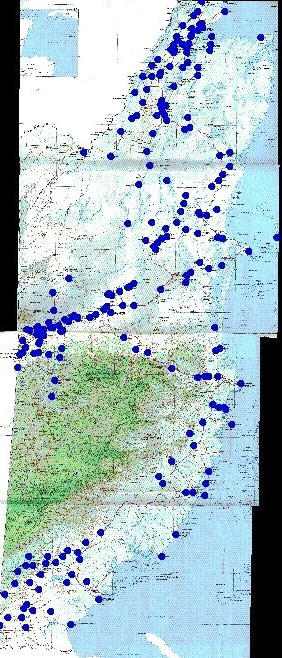
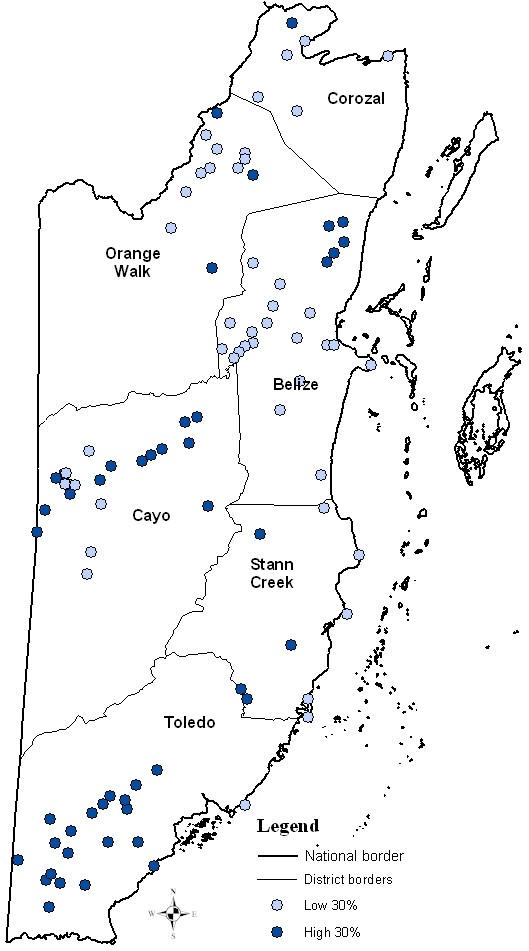
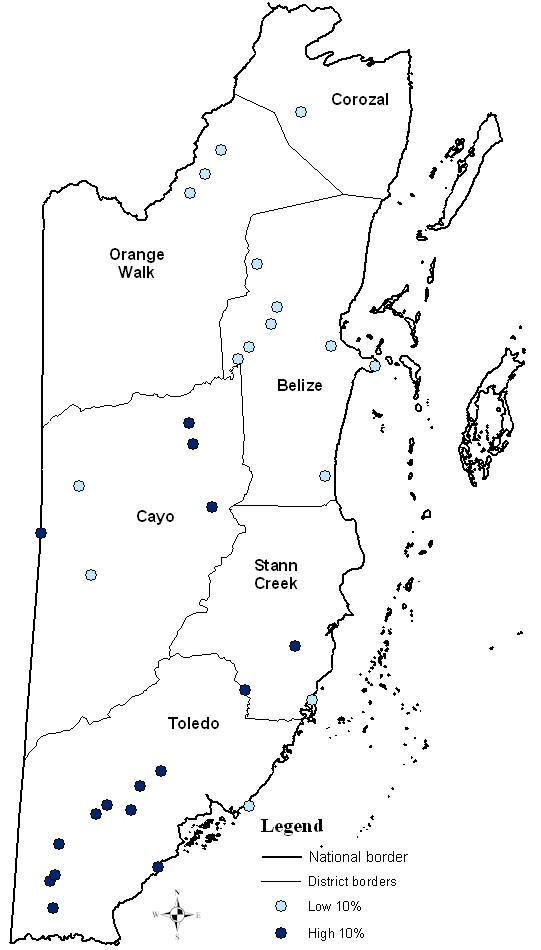
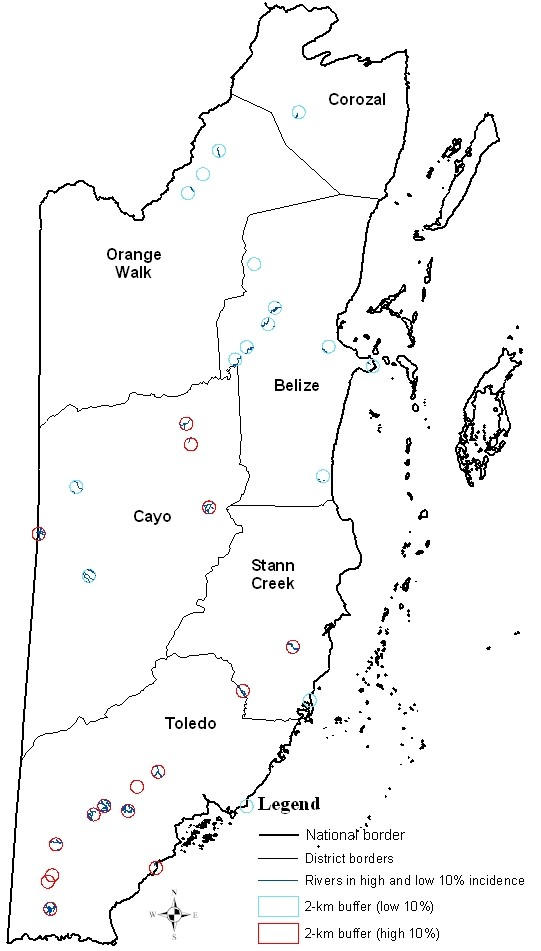
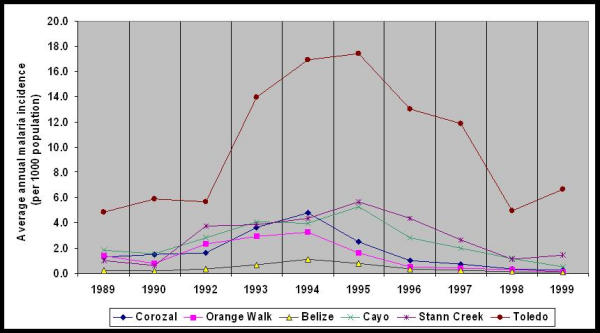
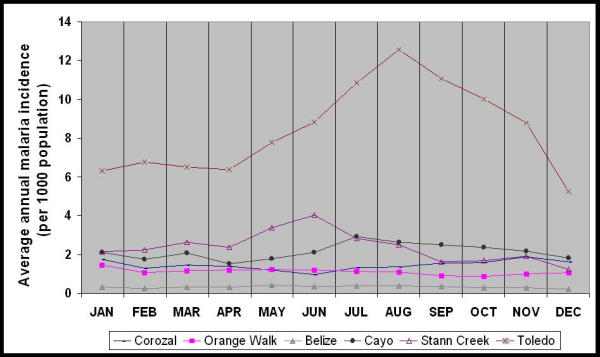
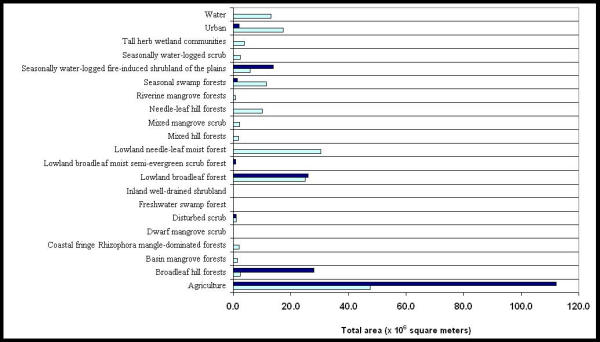
BACKGROUND: The purposes of this study were to map overall malaria incidence rates from 1989 through 1999 for villages in Belize; to assess the seasonal distribution of malaria incidence by region; and to correlate malaria incidence rates with vegetation cover and rivers in villages, using geographic information system technology.Malaria information on 156 villages was obtained from an electronic database maintained by the Belize National Malaria Control Program. Average annual malaria incidence rates per 1000 population over 10 years were calculated for villages using the 1991 population census as a denominator. Malaria incidence rates were integrated with vegetation cover from a 1995 vegetation map, and with river data from a digital data set. RESULTS: Mapping malaria incidence over the 10-year period in the study villages indicated the existence of a spatial pattern: the southern and western areas of Belize had consistently higher rates of malaria than northern areas. Examination of the seasonal distribution of malaria incidence by month over 10 years indicated that a statistically significant difference existed among districts and among months (p < 0.05). Spatial analysis of malaria incidence rates and of vegetation in Belize showed villages with high malaria rates having more broadleaf hill forests, agricultural land, and wetland vegetation types (i.e. SWF-seasonally waterlogged fire-induced shrubland of the plains). Statistical and spatial analyses of malaria incidence and of river distributions in Belize determined the high 10 percentile malaria incidence villages in western and southern Belize to have more rivers within two kilometers of the center of a village and a statistically significant correlation between proximity to rivers and villages (Spearman's gamma = -0.23; p < 0.05), especially in Stann Creek District (Spearman's gamma = -0.82; p < 0.05). CONCLUSIONS: Examination of the distribution of malaria during 10 years indicated transmission varied among geographic areas and among seasons. Additional studies are needed to examine, in more detail, the association between environmental and meteorological factors and malaria transmission. Furthermore, the role of An. darlingi in malaria transmission in Stann Creek needs further study since, of the three main vectors in Belize, An. darlingi has been found strongly associated with rivers.
Figures
References
-
- Beyers N, Gie RP, Zietsman HL, Kunneke M, Hauman J, Tatley M, Donald PR. The use of a geographical information system (GIS) to evaluate the distribution of tuberculosis in a high-incidence community. S Afr Med J. 1996;86:40–1, 44. - PubMed
-
- Kitron U. Landscape ecology and epidemiology of vector-borne diseases: tools for spatial analysis. J Med Entomol. 1998;35:435–445. - PubMed
Grants and funding
LinkOut - more resources
Full Text Sources
