

Review
Diffusion tensor imaging of cerebral white matter: a pictorial review of physics, fiber tract anatomy, and tumor imaging patterns
Affiliations
- PMID: 15037456
- PMCID: PMC8158568
Item in Clipboard
Review
Diffusion tensor imaging of cerebral white matter: a pictorial review of physics, fiber tract anatomy, and tumor imaging patterns
AJNR Am J Neuroradiol.
2004 Mar.
No abstract available
Figures
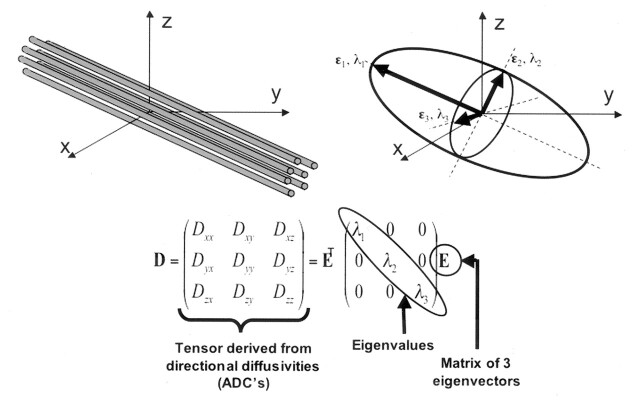
Top left, Fiber tracts have an arbitrary orientation with respect to scanner geometry (x, y, z axes) and impose directional dependence (anisotropy) on diffusion measurements. Top right, The three-dimensional diffusivity is modeled as an ellipsoid whose orientation is characterized by three eigenvectors (ϵ1, ϵ2, ϵ3) and whose shape is characterized three eigenvalues (λ1, λ2, λ3). The eigenvectors represent the major, medium, and minor priniciple axes of the ellipsoid, and the eigenvalues represent the diffusivities in these three directions, respectively. Bottom, This ellipsoid model is fitted to a set of at least six noncollinear diffusion measurements by solving a set of matrix equations involving the diffusivities (ADC’s) and requiring a procedure known as matrix diagonalization. The major eigenvector (that eigenvector associated with the largest of the three eigenvalues) reflects the direction of maximum diffusivity, which, in turn, reflects the orientation of fiber tracts. Superscript T indicates the matrix transpose.
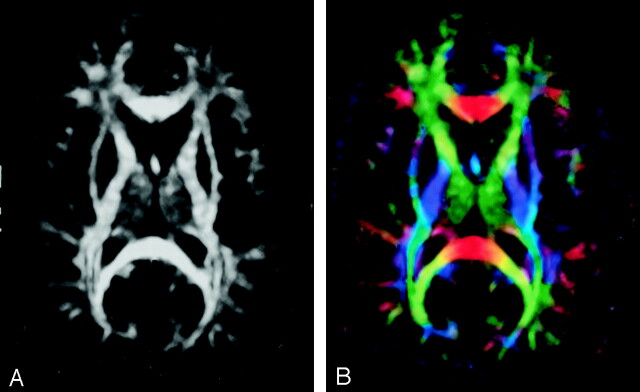
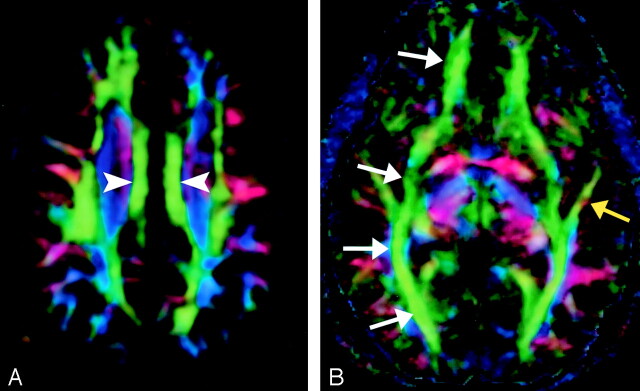
A, FA map without directional information. B, Combined FA and directional map. Color hue indicates direction as follows: red, left-right; green, anteroposterior; blue, superior-inferior. This convention applies to all the directional maps in this review. Brightness is proportional to FA.
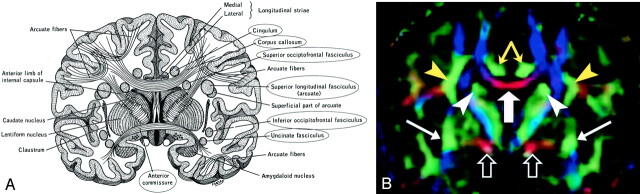
A, Illustration shows the anatomic relationships of several WM fiber tracts in the coronal plane. Circled tracts are those further illustrated in this review. The corpus callosum is “sandwiched” between the cingulum superomedially and the superior occipitofrontal fasciculus inferolaterally. The superior longitudinal fasciculus sweeps along the superior margin of the claustrum in a great arc. The inferior occipitofrontal fasciculus lies along the inferolateral edge of the claustrum. (Reproduced with permission from reference 20.) B, Directional map corresponding to A. The paired cingula are easily identified in green (yellow arrows) just cephalad to the red corpus callosum (thick white arrow). White arrowheads indicate superior occipitofrontal fasciculus; thin white arrows, inferior occipitofrontal fasciculus; yellow arrowheads, superior longitudinal fasciculus. Like the corpus callosum, the commissural fibers of the anterior commissure are left-right oriented toward the midline, resulting in the characteristic red (open arrows) on this DTI map. Further lateral, the fibers diverge and mingle with other tracts; they are no longer identifiable with DTI, but can be traced with tractography.
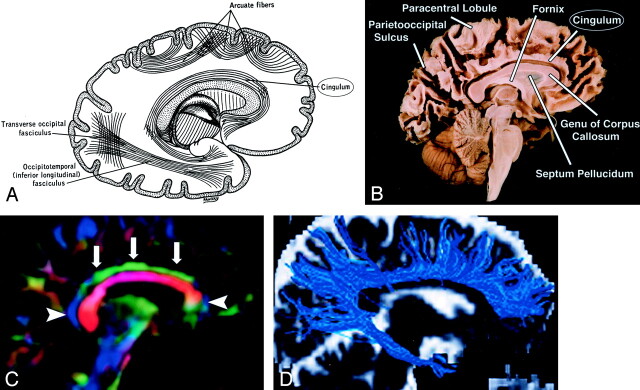
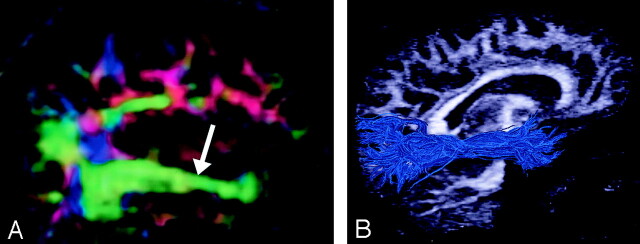
Cingulum, sagittal view. A, Illustration shows the cingulum arching over the corpus callosum. B, Gross dissection, median view. C, Directional map. Because DTI reflects tract orientation voxel by voxel, the color changes from green to blue as the cingulum (arrows) arches around the genu and splenium (arrowheads). Green indicates anteroposterior; red, left-right; blue, superior-inferior. D, Tractogram. (See also Fig 5A, axial directional map.)
A, Cingulum, axial directional map. The paired cingula (arrowheads) are easily identified in green on this section obtained just cephalad to the corpus callosum. B, Inferior occipitofrontal fasciculus (white arrows) and inferior longitudinal fasciculus (yellow arrow), axial directional map. The inferior occipitofrontal fasciculus lies in a roughly axial plane and is easily identified in green; it connects frontal and occipital lobes at the level of the midbrain. Posteriorly, the inferior occipitofrontal fasciculus mingles with the inferior longitudinal fasciculus, optic radiations, superior longitudinal fasciculus, and other fibers to form the sagittal stratum—a vast and complex bundle that connects the occipital lobe to the rest of the brain.
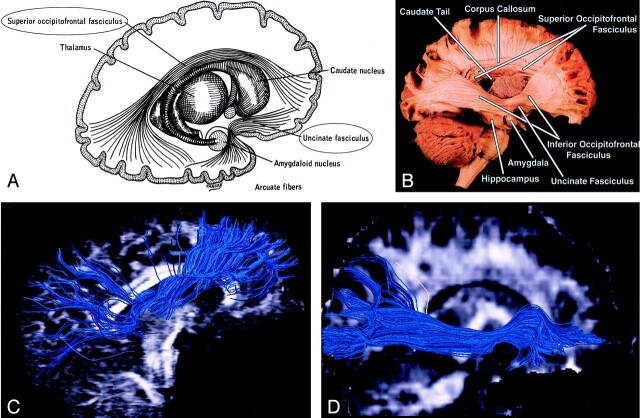
Superior and inferior occipitofrontal fasciculi and uncinate fasciculus, sagittal view. A, Illustration shows the superior occipitofrontal fasciculus arching over the caudate nucleus to connect frontal and occipital lobes, and the uncinate fasciculus hooking around the lateral sulcus to connect inferior frontal and anterior temporal lobes (see also uncinate fasciculus in Figs 7 and 8B). B, Gross dissection, lateral view. Like the superior occipitofrontal fasciculus, the inferior occipitofrontal fasciculus connects the frontal and occipital lobes, but it lies more caudad, running inferolateral to the claustrum (see also Fig 5B for axial view). The middle portion of the inferior occipitofrontal fasciculus is bundled together with the middle portion of the uncinate fasciculus. C and D, Tractograms of the superior (C) and inferior (D) occipitofrontal fasciculi.
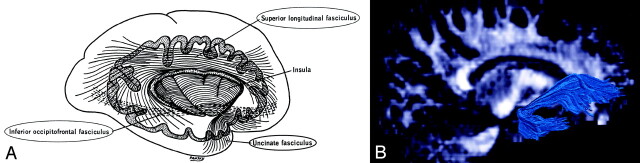
Uncinate fasciculus and superior longitudinal fasciculus, sagittal view. A, Illustration shows the uncinate fasciculus hooks around the lateral sulcus to connect inferior frontal and anterior temporal lobes. B, Tractogram. (See also Fig 6B for gross dissection.)
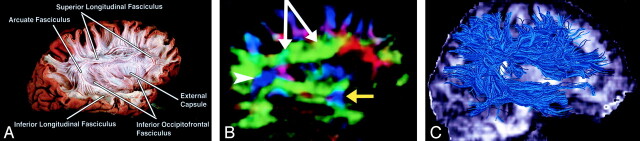
Superior longitudinal fasciculus, sagittal view. This massive fiber bundle sweeps along the superior margin of the claustrum in a great arc. The term arcuate fasciculus is often used in reference to the superior longitudinal fasciculus or, specifically, its more arcuate portion. A, Gross dissection, lateral view. B, Directional map, parasagittal section. Note the color change from green to blue as the superior longitudinal fasciculus fibers turn from an anteroposterior orientation (white arrows) to a more superior-inferior orientation (arrowhead). The same phenomenon can also be seen in the uncinate fasciculus (yellow arrow). C, Tractogram. (See also Fig 7A.)
Inferior longitudinal (occipitotemporal) fasciculus. A, Directional map, parasagittal section, shows the inferior longitudinal fasciculus (arrow). B, Tractogram. (See also Fig 8A for gross dissection and Fig 5B for axial directional map.)
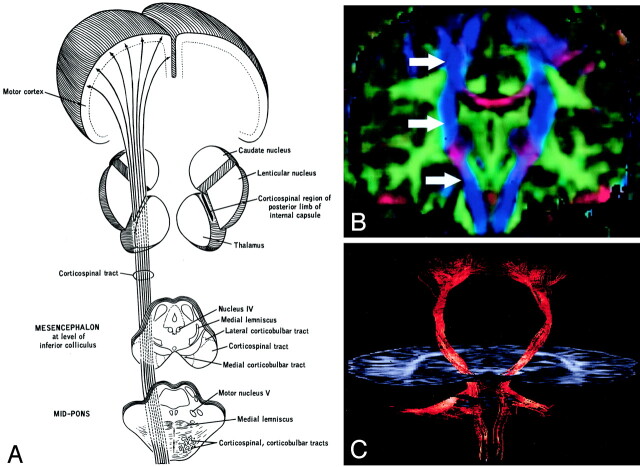
Corticospinal tract. A, Illustration. (Twisting of the tract superior to the internal capsule not shown.) Corticospinal fibers originating along the motor cortex converge through the corona radiata and posterior limb of the internal capsule on their way to the lateral funiculus of the spinal cord. B, Coronal directional map. Corticospinal fibers (arrows) are easily identified in blue on this DTI map owing to their predominantly superior-inferior orientation. The fibers take on a more violet hue as they turn medially to enter the cerebral peduncles, then become blue again as they descend through the brain stem. Corticospinal fibers run with corticobulbar and corticopontine fibers; these cannot be distinguished on directional maps but can be parsed by using tractographic techniques. C, Tractogram.
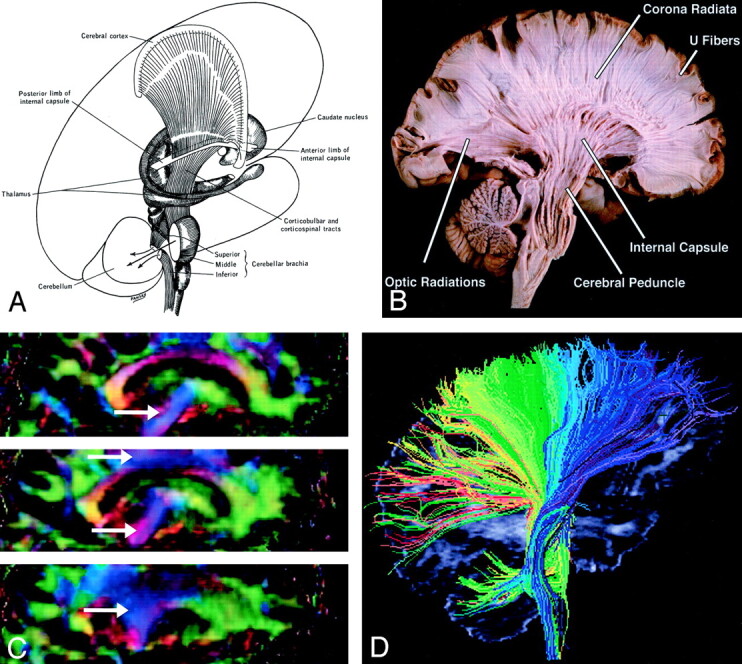
A and B, Illustration (A) and gross dissection, medial view (B) of the corona radiata. C, Directional map, three adjacent parasagittal sections, with corona radiata identifiable in blue (arrows). Corona radiata fibers interdigitate with laterally directed callosal fibers, resulting in assorted colors in the vicinity of their crossing. D, Tractogram in which different portions of the corona radiata have been parsed by initiating the tractographic algorithm from different starting locations.
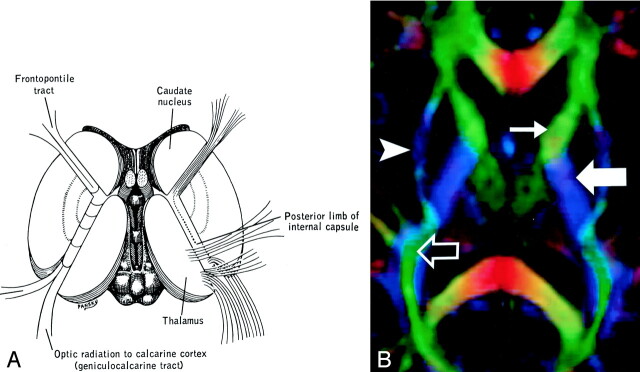
Internal capsule, axial view. A and B, Illustration (A) and directional map (B). Because the anterior limb (small arrow) primarily consists of anteroposteriorly directed frontopontine and thalamocortical projections, it appears green on this DTI map. The posterior limb (large solid arrow), which contains the superior-inferiorly directed tracts of the corticospinal, corticobulbar, and corticopontine tracts, is blue. Note also the blue fibers of the external capsule (arrowhead) and the green fibers of the optic radiations (open arrow) in the retrolenticular portion of the internal capsule.
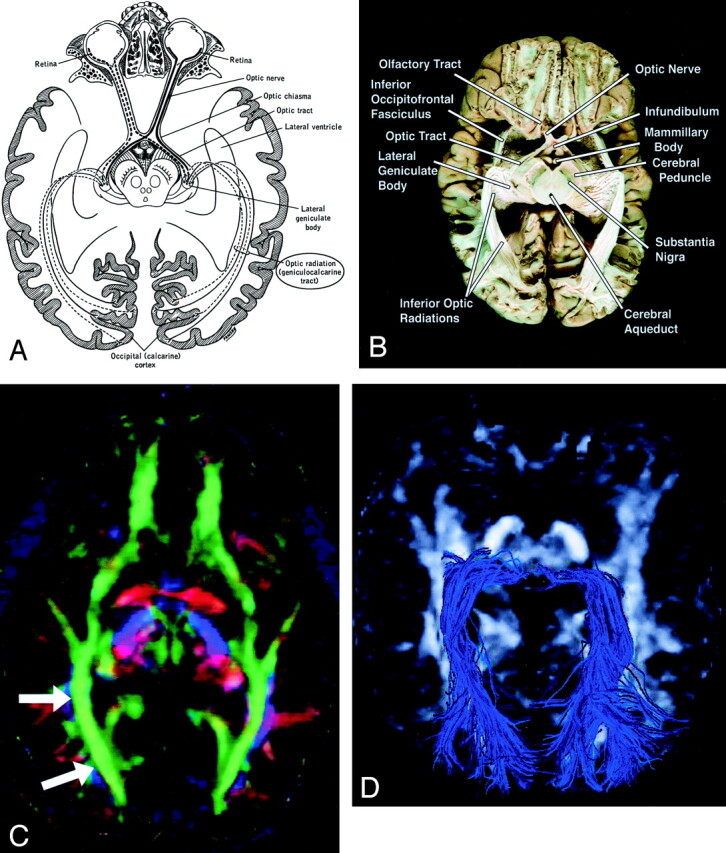
Geniculocalcarine tract (optic radiation), axial view. A–D, Illustration (A), gross dissection (B), directional map (C), and tractogram (D). As this tract connects the lateral geniculate nucleus to occipital (primary visual) cortex, the fibers sweep around the posterior horn of the lateral ventricle and terminate in the calcarine cortex (more cephalad fibers of the optic radiation take a more direct path to the visual cortex). The optic radiation (arrows) mingles with the inferior occipitofrontal fasciculus, inferior longitudinal fasciculus, and the inferior aspect of superior longitudinal fasciculus to form much of the sagittal stratum in the occipital lobe.
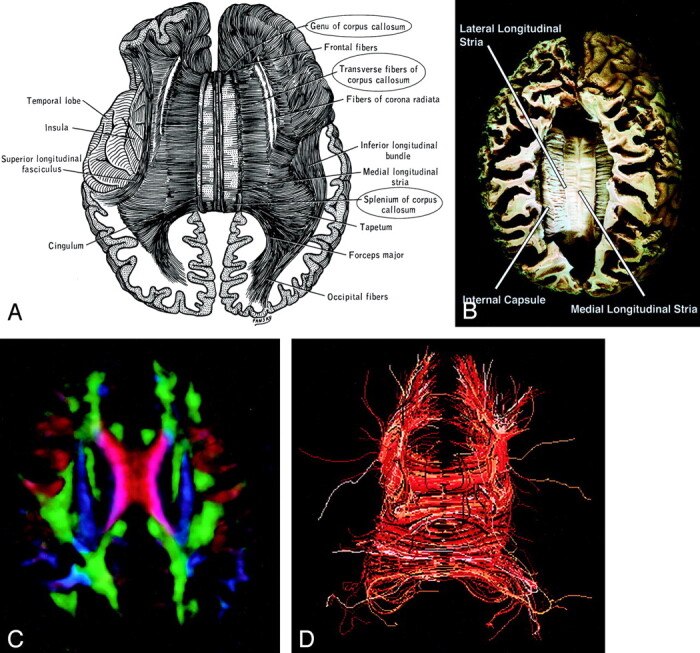
Corpus callosum, axial view. A–D, Illustration (A), gross dissection (B), directional map (C), and tractogram (D). The largest WM fiber bundle, the corpus callosum connects corresponding areas of cortex between the hemispheres. Close to the midline, its fibers are primarily left-right oriented, resulting in its red appearance on this DTI map. However, callosal fibers fan out more laterally and intermingle with projection and association tracts, resulting in more complex color patterns.
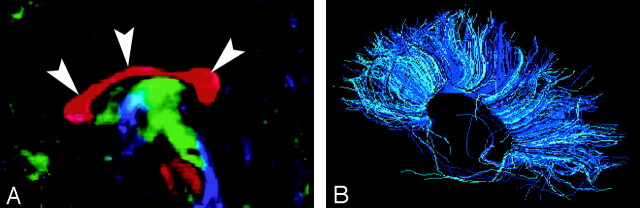
A and B, Sagittal directional map of the corpus callosum (arrowheads) (A) and tractogram (B). (See also Fig 14.)
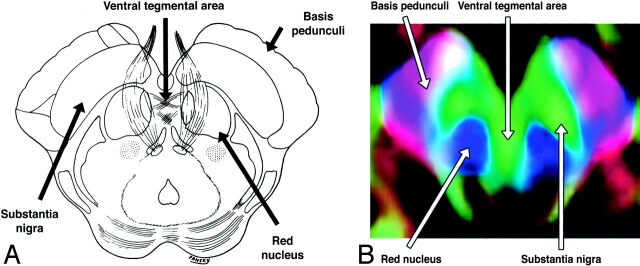
A and B, Axial illustration (A) and directional map (B) of the rostral midbrain.
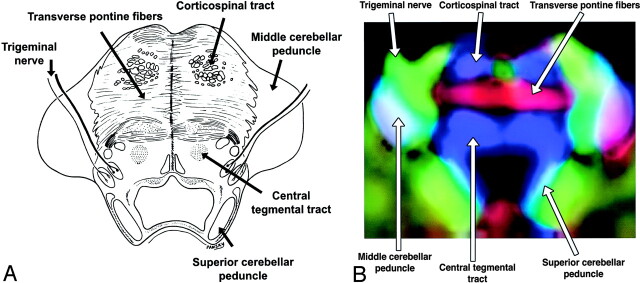
A and B, Axial illustration (A) and directional map (B) of the midpons.
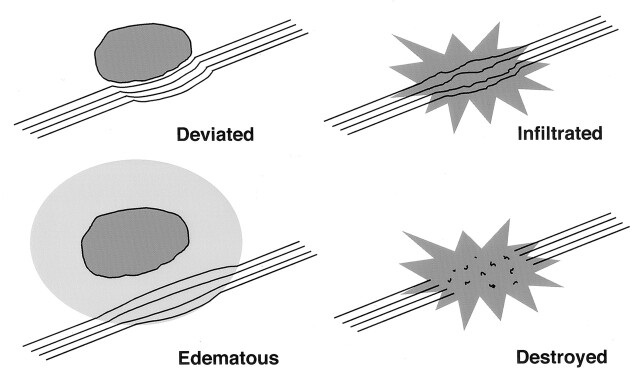
Potential patterns of WM fiber tract alteration by cerebral neoplasms. The extent to which these patterns can be discriminated on the basis of DTI is under investigation.
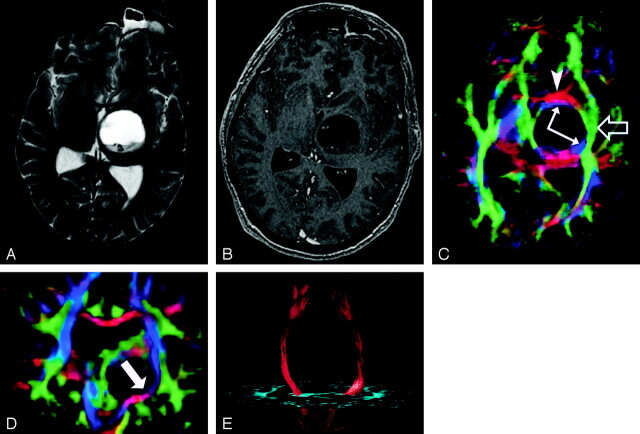
DTI pattern 1: normal anisotropy, abnormal location or orientation. A–E, T2-weighted MR image (A), contrast-enhanced T1-weighted image (B), directional maps in axial (C) and coronal (D) planes, and coronal tractogram of bilateral corticospinal tracts (E). WM tracts are deviated anteriorly, inferiorly, and posterolaterally by this ganglioglioma but retain their normal anisotropy. Therefore, they remain readily identified on DTI (C and D) and readily traced with tractography (E). The AC (red, arrowhead), IOFF (green, open arrow), and CST (blue, solid arrows) are deviated. Note the blue hue of the CST change to red as it deviates toward the axial plane by the tumor (arrow on coronal view [D]).
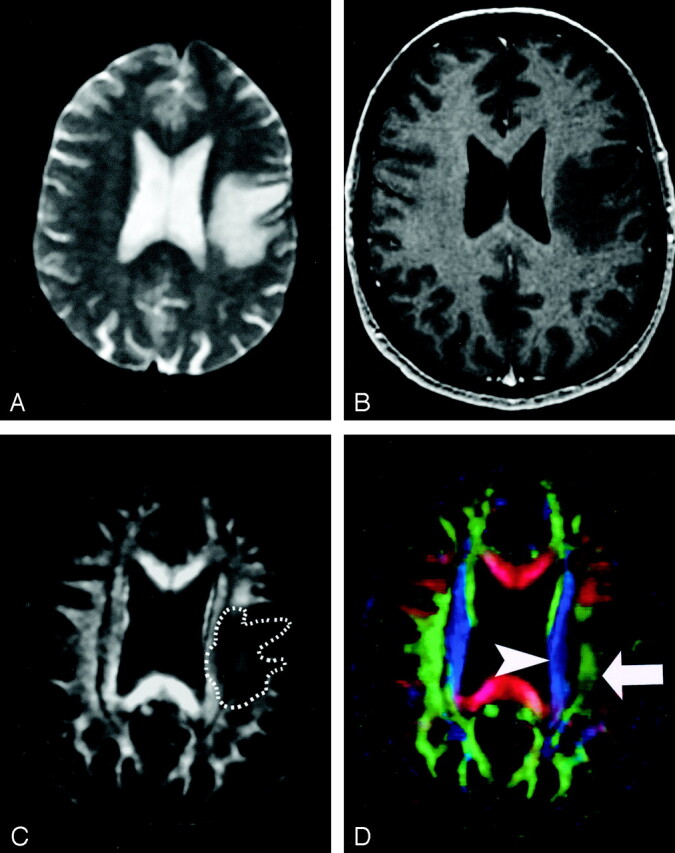
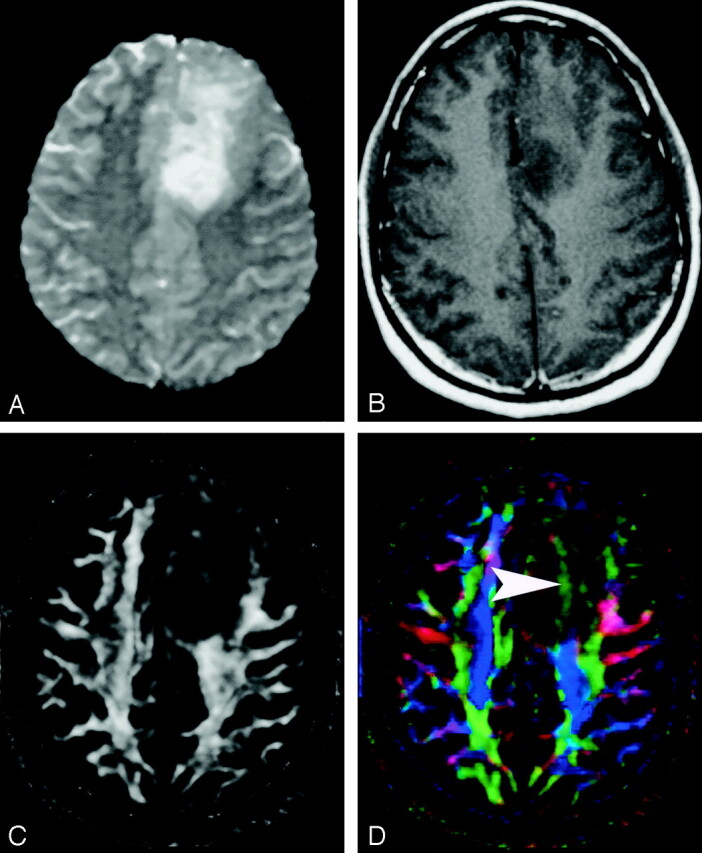
DTI pattern 2: abnormal (low) anisotropy, normal location and orientation. A–D, T2-weighted MR image (A), contrast-enhanced T1-weighted MR image (B), FA map (C), and directional map (D). The homogeneous region of hyperintensity on the T2-weighted image represents vasogenic edema surrounding a small metastasis (on another section, not shown). Despite diminished anisotropy in this region (darker region outlined on FA map) and diminished color brightness on directional map, the involved fiber tracts retain their normal color hues on the directional map (superior longitudinal fasciculus, green, arrow; corona radiata, blue, arrowhead). This preservation of normal color hues despite a substantial decrease in anisotropy is consistent with the abnormality of vasogenic edema, which enlarges the extracellular space (allowing less restricted diffusion perpendicular to axonal fibers, thus reducing the anisotropy) without disrupting cellular membranes, leaving their directional organization intact. It is not yet known to what extent this pattern is specific for edema, however.
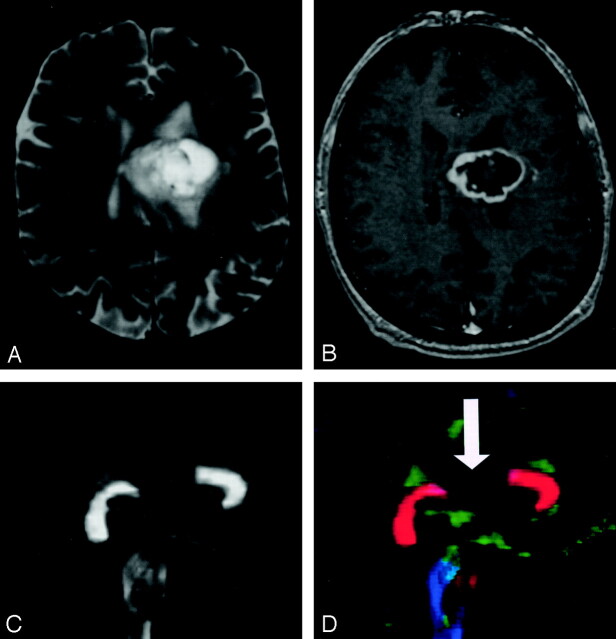
DTI pattern 3: abnormal (low) anisotropy, abnormal orientation. A–D, T2-weighted MR image (A), contrast-enhanced T1-weighted image (B), FA map (C), and directional map (D). This infiltrating astrocytoma is characterized by both diminished anisotropy and abnormal color (arrowhead) on the directional map, suggesting disruption of WM fiber tract organization more severe and complex than that seen with pattern 2 (compare Fig 20). Note that the color change cannot easily be attributed to bulk mass effect as in purely deviated tracts.
DTI pattern 4: near-zero anisotropy, tract unidentifiable. A–D, T2-weighted MR image (A), contrast-enhanced T1-weighted image (B), FA map (C), and directional map (D). This high-grade astrocytoma has destroyed the body of the corpus callosum, rendering the diffusion essentially isotropic and precluding identification on the directional map (arrow).
References
-
- Mori S, Kaufmann WE, Davatzikos C, et al. Imaging cortical association tracts in the human brain using diffusion-tensor-based axonal tracking. Magn Reson Med 2002;47:215–223 - PubMed
-
- Mori S, van Zijl PCM. Fiber tracking: principles and strategies—a technical review. NMR Biomed 2002;15:468–480 - PubMed
-
- Basser PJ, Jones DK. Diffusion-tensor MRI: theory, experimental design and data analysis—a technical review. NMR Biomed 2002;15:456–467 - PubMed
Publication types
MeSH terms
Grants and funding
LinkOut - more resources
Full Text Sources
Other Literature Sources