. 2004 Mar 23:5:11.
doi: 10.1186/1471-2202-5-11.

The extracellular matrix, p53 and estrogen compete to regulate cell-surface Fas/Apo-1 suicide receptor expression in proliferating embryonic cerebral cortical precursors, and reciprocally, Fas-ligand modifies estrogen control of cell-cycle proteins

Affiliations

The extracellular matrix, p53 and estrogen compete to regulate cell-surface Fas/Apo-1 suicide receptor expression in proliferating embryonic cerebral cortical precursors, and reciprocally, Fas-ligand modifies estrogen control of cell-cycle proteins

Zulfiqar F Cheema et al. BMC Neurosci. .

Abstract

Background: Apoptosis is important for normal cerebral cortical development. We previously showed that the Fas suicide receptor was expressed within the developing cerebral cortex, and that in vitro Fas activation resulted in caspase-dependent death. Alterations in cell-surface Fas expression may significantly influence cortical development. Therefore, in the following studies, we sought to identify developmentally relevant cell biological processes that regulate cell-surface Fas expression and reciprocal consequences of Fas receptor activation.

Results: Flow-cytometric analyses identified two distinct neural sub-populations that expressed Fas on their cell surface at high (FasHi) or moderate (FasMod) levels. The anti-apoptotic protein FLIP further delineated a subset of Fas-expressing cells with potential apoptosis-resistance. FasMod precursors were mainly in G0, while FasHi precursors were largely apoptotic. However, birth-date analysis indicated that neuroblasts express the highest levels of cell-surface Fas at the end of S-phase, or after their final round of mitosis, suggesting that Fas expression is induced at cell cycle checkpoints or during interkinetic nuclear movements. FasHi expression was associated with loss of cell-matrix adhesion and anoikis. Activation of the transcription factor p53 was associated with induction of Fas expression, while the gonadal hormone estrogen antagonistically suppressed cell-surface Fas expression. Estrogen also induced entry into S-phase and decreased the number of Fas-expressing neuroblasts that were apoptotic. Concurrent exposure to estrogen and to soluble Fas-ligand (sFasL) suppressed p21/waf-1 and PCNA. In contrast, estrogen and sFasL, individually and together, induced cyclin-A expression, suggesting activation of compensatory survival mechanisms.

Conclusions: Embryonic cortical neuronal precursors are intrinsically heterogeneous with respect to Fas suicide-sensitivity. Competing intrinsic (p53, cell cycle, FLIP expression), proximal (extra-cellular matrix) and extrinsic factors (gonadal hormones) collectively regulate Fas suicide-sensitivity either during neurogenesis, or possibly during neuronal migration, and may ultimately determine which neuroblasts successfully contribute neurons to the differentiating cortical plate.


Figures

Figure 1
Figure 1
(A) Flow cytometric analyses of independent samples GD15 cortex show more cells expressing Fas immuno-fluorescence in samples #1–#4, compared to pre-immune serum control. Gate 'M' was set to exclude background fluorescence, or 98% of neuroblasts in the control sample (B & C) immunohistochemical analysis of cultured embryonic cortical neurons indicates Fas-immunoreactivity is localized to the soma and proximal processes (arrow). Immunohistochemical controls (arrow, C) show lack of staining in neurons. (D) Graph (Mean ± SEM) of the percentage of Fas-expressing precursors that also co-localize the pro-apoptotic DISC adapter protein FADD, or the anti-apoptotic inhibitor FLIP.
Figure 2
Figure 2
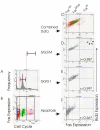
Identification of two unique populations of cell-surface Fas-expressing precursors (A-D). Flow cytometric analysis of the cell-cycle distribution of cultured embryonic cortical precursors (A), based on frequency histogram analysis of propidium iodide (PI) incorporation into DNA in 10,000 cells from each sample, indicates that a majority of cells precursors are in G0. Precursors with DNA content G0 DNA content were identified as being in S-G2-M. (B,C) Scatter-plots of two representative independent samples of embryonic cortical-derived neuronal precursors analyzed for combined cell-surface Fas immuno-fluorescence (y-axis) and PI incorporation (cell-cycle stage, x-axis). Based on background immuno-fluorescence patterns in the pre-immune serum controls (D), precursors were characterized as negative Fas-expressing (Fas-ve, expressing <2 × 100 fluorescence units [FUs]), moderate Fas-expressing (FasMod, expressing >2 × 100 and <102 FUs) and high cell surface Fas-expressing (FasHi, >102 FUs). These categories remained consistent across experiments. (E & F) Graphical representation (Mean ± SEM) of the proportion of precursors expressing high (FasHi, E) and moderate (FasMod, F) levels of cell-surface Fas at different stages of cell cycle and apoptosis, expressed as a percentage of control. Asterisks indicate statistically significant differences in cell-stage-specific expression of cell surface Fas, p < 0.05.
Figure 3
Figure 3
Relationship between Anoikis (apoptosis due to loss of cell adhesion) and cell surface Fas-expression. (A,C) Sample frequency histograms of PI incorporation (DNA content) in adherent (A) and non-adherent (C) precursors indicates that adherent precursors are mainly in G0, while non-adherent precursors are mainly apoptotic. (B, D) Scatter-plots of combined analysis of PI (x-axis) and cell-surface Fas immunofluorescence (y-axis) indicates that adherent precursors largely express moderate levels of cell-surface Fas (FasMod, B), while non-adherent precursors also express high levels of Fas (FasHi, D). (E) Graph (Mean + SEM) showing that collagenase-A treatment significantly increased the number of cells expressing cell-surface Fas, relative to controls. Asterisk indicates p < 0.05.
Figure 4
Figure 4
Relationship between cell-surface Fas expression and BrdU incorporation at different stages of cell cycle or apoptosis (PI incorporation) in adherent primary precursors. (A,B) Representative frequency histogram of PI incorporation (A) and scatter-plot of combined PI incorporation and Fas immunofluorescence (B) indicates the thresholds for the separate analysis of BrdU content in neuroblasts at S/G2/M (pink), G0 (green), or apoptosis (red). (C-F) Representative scatter-plots of the overall positive relationship between Fas expression and BrdU incorporation (C) and separated by cell-phase, S/G2/M (D), G0 (E) and apoptosis (F). Arrows in S/G2/M condition (D) indicate a group of cells that exhibited the highest levels of BrdU incorporation (suggesting recent completion of S-phase) and cell-surface Fas expression. Insets in figures D,E and F indicate Pearson's product moment correlations (obtained by averaging intensities across 6 independent samples). Asterisks indicate that the correlation was statistically significant with a 2-tailed test. These data indicate that the correlation between BrdU incorporation and cell-surface Fas expression is higher during cell cycle and G0 as compared to apoptosis.
Figure 5
Figure 5
Fas expression is associated with p53 activation. (A) Sample flow cytometric scatter-plot showing a strong positive association between the intensity of p53 phosphorylation (pp53) and cell surface Fas expression in primary cortical precursors. Asterisk indicates statistical significance of Pearson's product moment correlation (inset). (B,C) Sample western blot (B) and quantitative densitometric analysis of Fas expression in conditionally immortalized CHB50 cerebral cortical neuroblasts under -p53 conditions (+tsTA/-pp53) and under +p53 conditions (-tsTA/+pp53) for 24 or 48 hours.
Figure 6
Figure 6
Estrogen promotes cell cycle in adherent primary cortical precursors: (A) Sample frequency (y-axis) distributions of PI intensity (x-axis) along with the best-fit distributions of cells in apoptosis, G0/G1, S-phase or G2/M. The area under the curve delineated by diagonal lines (S-phase) is greater in estrogen (E2)-treated cultures compared to controls. (B-E) Quantitative analysis of control and E2 treated cultures showing the mean % of cells ± SEM in G0 (B), S-phase (C), G2/M (D) or apoptosis (E). Asterisks indicate statistical significance at p < 0.05.
Figure 7
Figure 7
Estrogen suppresses Fas expression in adherent primary cortical precursors: (A) Sample flow cytometric scatter plots from two control and two E2 treated cultures, showing Fas intensity (y-axis) plotted against cell-cycle stage (PI intensity, x-axis). Scatter plots depict a general suppression in cell surface Fas intensity in E2 treated cultures compared to controls. (B,C,E) Quantitative analysis (mean ± SEM) of the number of cells expressing Fas (FasMod + FasHi) in control and E2 treated cultures, normalized to controls. Since these analyses were performed on adherent cells, the FasHi population was insignificant. (D) Quantitative analysis of the mean cell-surface intensity of Fas expression in control and E2 treated cultures. Asterisks indicate statistical significance at p < 0.05.
Figure 8
Figure 8
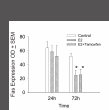
Densitometric analyses of western immunoblots of samples obtained from conditionally immortalized CHB50 cortical neuroblasts cultured for 24 or 72 hours following p53 induction (-tsTA/+pp53 condition). During this duration, cultures were maintained either under control conditions or were exposed to E2 alone or E2 with tamoxifen. E2 induced a significant decrease in Fas that was not reversed by concurrent exposure to tamoxifen. Asterisks indicate statistical significance at p < 0.05.
Figure 9
Figure 9
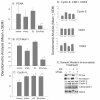
Estrogen (E2) and sFasL cooperate to regulate cell-cycle proteins. Densitometric analyses of western immunoblots of primary embryonic precursors treated with sFasL or E2 alone or sFasL concurrently with E2. Concurrent exposure sFasL and E2 suppress PCNA (A) and p21/Waf-1 (B) expression at 12 hours. sFasL and E2 separately and together induce cyclin-A (C). sFasL and E2 either alone or together do not regulate the expression of cyclin-E, CDK1/CDC2 or CDK2 (D). (E) Sample western immunoblots showing regulation of the expression of cell-cycle proteins following treatment with sFasL or E2 alone or together. p21Waf-1, cyclin-E and CDK-2 images were each cropped from one single immunoblot to eliminate non-relevant treatment conditions. Asterisks indicate statistical significance at p < 0.05.
Figure 10
Figure 10
Models of Fas-mediated suicide sensitivity of precursors during cell cycle, and following disruption of cell-matrix interactions. Ventricular zone (VZ), interkinetic nuclear movement model: Our data shows that during cell cycle, cell-surface Fas expression is highest in neuroblasts that also exhibit the highest level of BrdU incorporation. Such a relationship would occur at the end of S-phase, perhaps reflecting DNA replication errors. Therefore, Fas expression (indicated in the cartoon by a green peri-cellular halo), and hence suicide-sensitivity would be highest during the ventricular-fugal interkinetic movement of nuclei transitioning through G2. Resident Fas-ligand expressing cells (indicated by pacman figures) could eliminate defective Fas-expressing neuroblasts. Cortical plate (CP), 'anoikis' model: Cortical neuroblasts utilize integrin-mediated signals to migrate along radial glia and into the laminae of the cortical plate [98]. Collagenase-A disrupts integrin-collagen interactions, and our data shows that collagenase-A leads to increased cell-surface Fas expression. Therefore, the induction of the Fas receptor may underlie the process of 'anoikis'. 'Anoikis' in turn, may protect the developing cerebral cortex from migration errors. Abbreviations: V = ventricular zone, VZ = ventricular zone, CP = cortical plate.

References

    1. Ferrer I, Bernet E, Soriano E, DelRio T, Fonseca M. Naturally occurring cell death in the cerebral cortex of the rat and removal of dead cells by transitory phagocytes. Neuroscience. 1990;39:451–458. doi: 10.1016/0306-4522(90)90281-8. - DOI - PubMed
    1. Ferrer I, Soriano E, DelRio J, Alcantara S, Auladell C. Cell death and removal in the cerebral cortex during development. ProgNeurobiol. 1992;39:1–43. doi: 10.1016/0301-0082(92)90029-E. - DOI - PubMed
    1. Finlay B, Slattery M. Local differences in the amount of early cell death in neocortex predict adult local specializations. Science. 1983;219:1349–1351. - PubMed
    1. Spreafico R, Frassoni C, Arcelli P, Selvaggio M, De Biasi S. In situ labeling of apoptotic cell death in the cerebral cortex and thalamus of rats during development. J Comp Neurol. 1995;363:281–295. - PubMed
    1. Rabinowicz T, De Courten-Myers GM, Petetot JM-S, Xi G, De Los Reyes E. Human cortex development: Estimates of neuronal numbers indicate major loss late during gestation. Journal of Neuropathology and Experimental Neurology. 1996;55:320–328. - PubMed

Publication types

MeSH terms