Comparative Study
. 2004 Feb 11;5(1):14.
doi: 10.1186/1471-2164-5-14.

Genomic structure and alternative splicing of murine R2B receptor protein tyrosine phosphatases (PTPkappa, mu, rho and PCP-2)

Affiliations
Comparative Study

Genomic structure and alternative splicing of murine R2B receptor protein tyrosine phosphatases (PTPkappa, mu, rho and PCP-2)

Julie Besco et al. BMC Genomics. .

Abstract

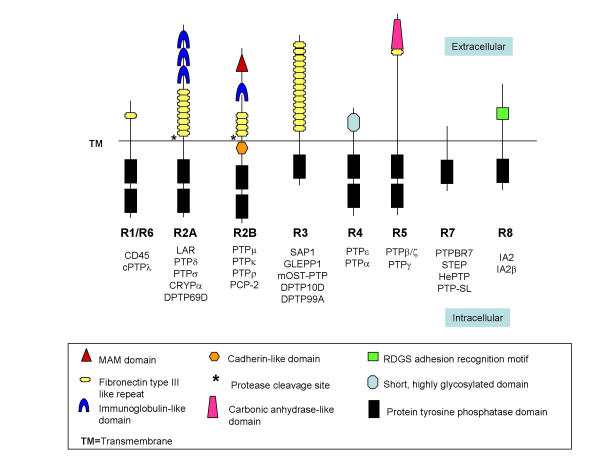
Background: Four genes designated as PTPRK (PTPkappa), PTPRL/U (PCP-2), PTPRM (PTPmu) and PTPRT (PTPrho) code for a subfamily (type R2B) of receptor protein tyrosine phosphatases (RPTPs) uniquely characterized by the presence of an N-terminal MAM domain. These transmembrane molecules have been implicated in homophilic cell adhesion. In the human, the PTPRK gene is located on chromosome 6, PTPRL/U on 1, PTPRM on 18 and PTPRT on 20. In the mouse, the four genes ptprk, ptprl, ptprm and ptprt are located in syntenic regions of chromosomes 10, 4, 17 and 2, respectively.

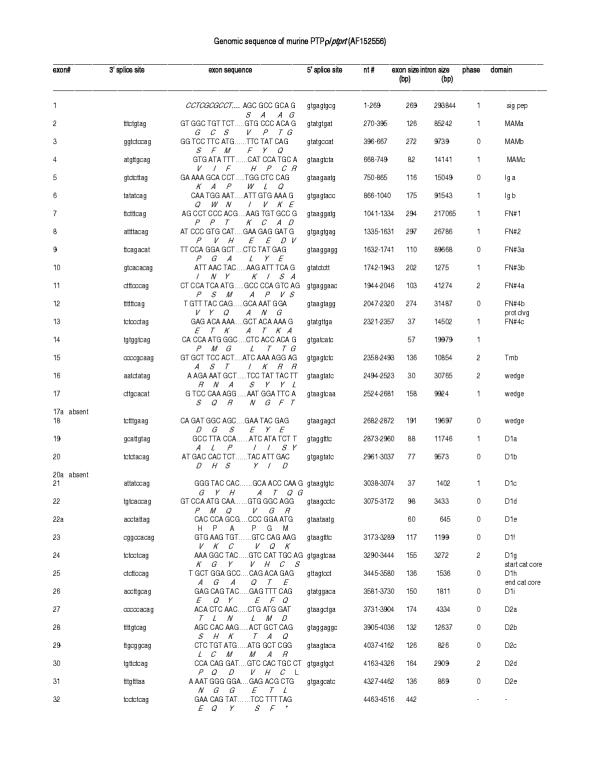
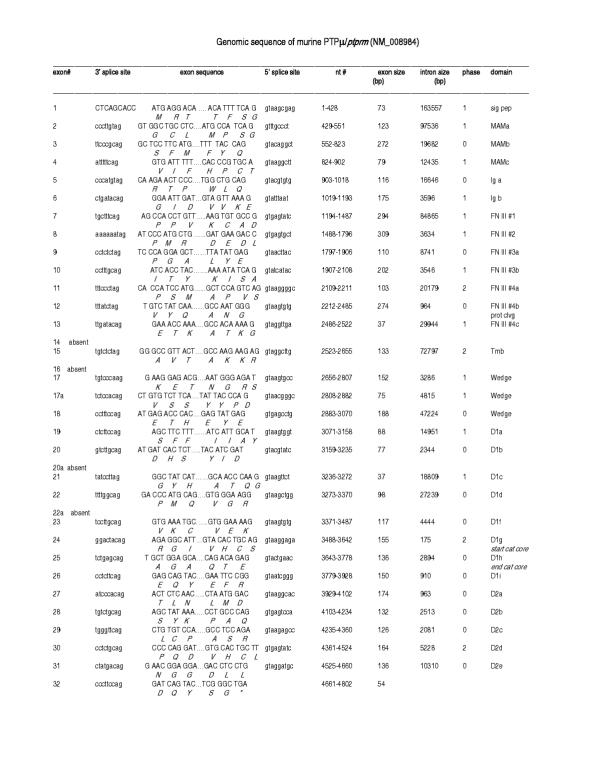
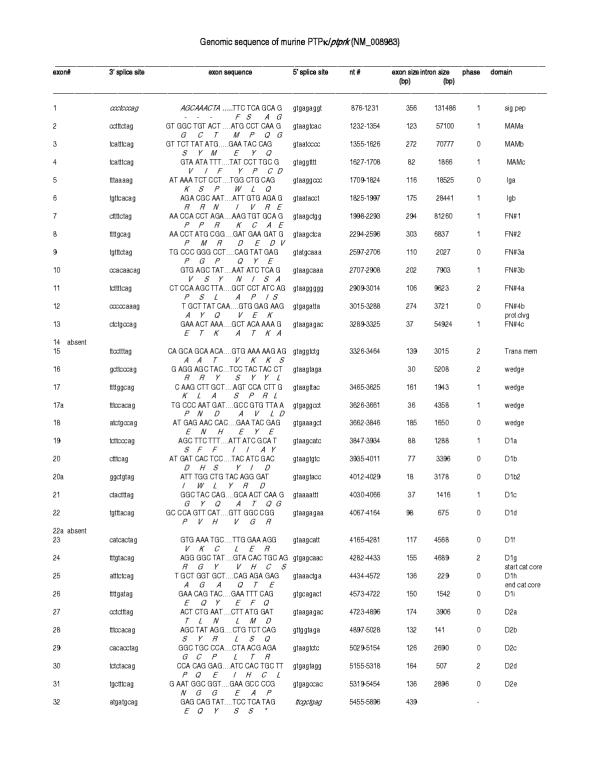
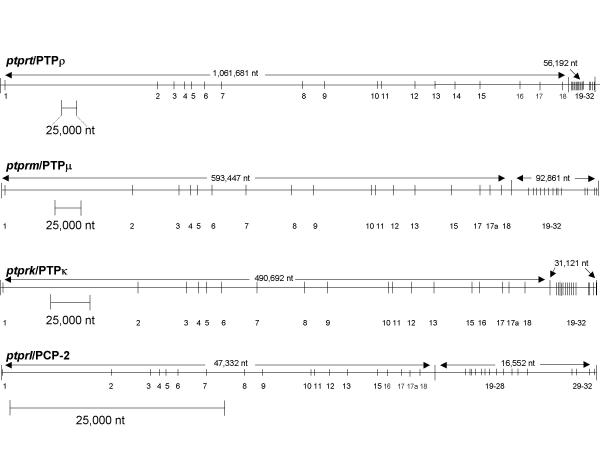
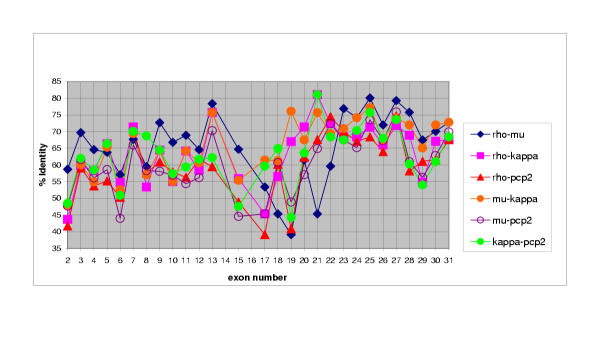
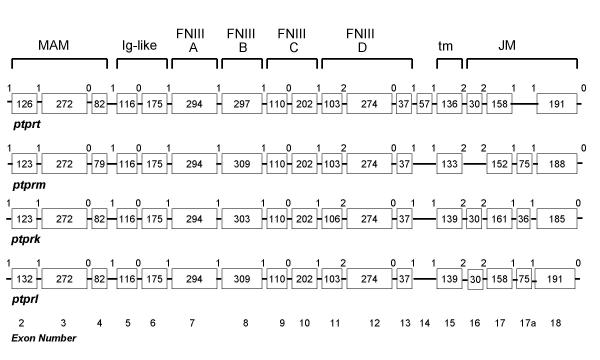
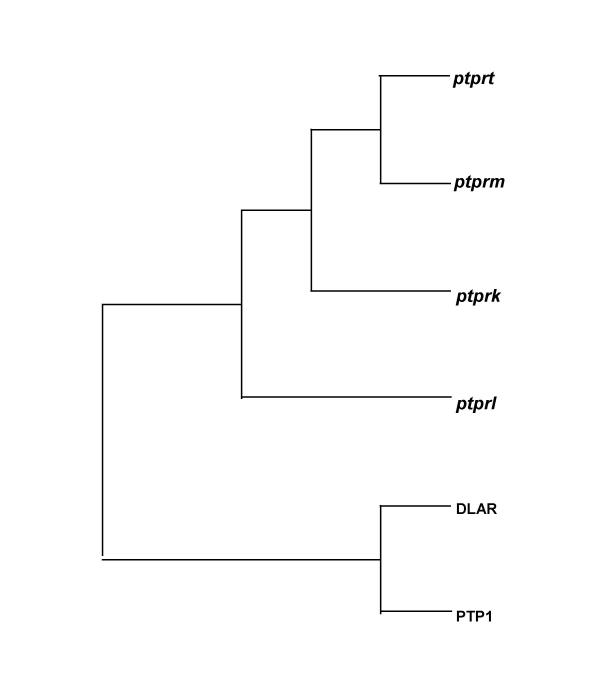
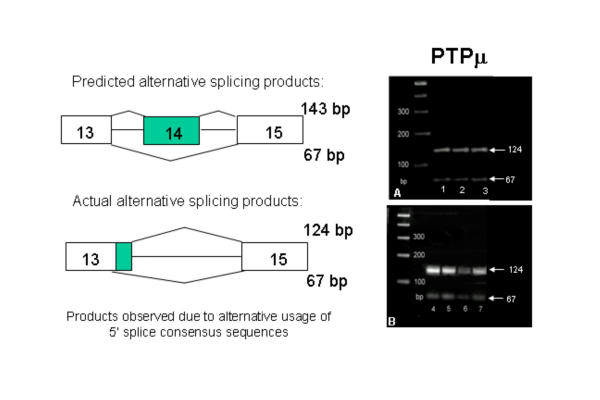
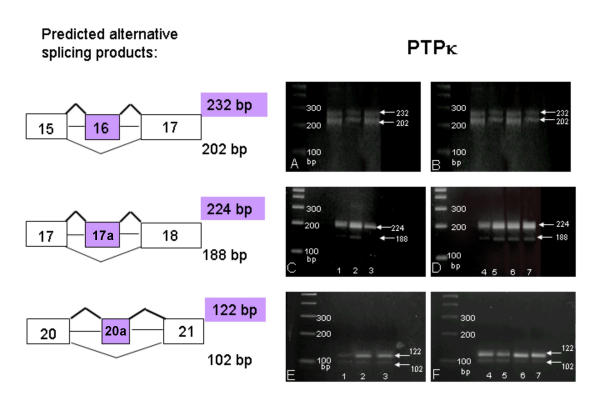
Results: The genomic organization of murine R2B RPTP genes is described. The four genes varied greatly in size ranging from approximately 64 kb to approximately 1 Mb, primarily due to proportional differences in intron lengths. Although there were also minor variations in exon length, the number of exons and the phases of exon/intron junctions were highly conserved. In situ hybridization with digoxigenin-labeled cRNA probes was used to localize each of the four R2B transcripts to specific cell types within the murine central nervous system. Phylogenetic analysis of complete sequences indicated that PTPrho and PTPmu were most closely related, followed by PTPkappa. The most distant family member was PCP-2. Alignment of RPTP polypeptide sequences predicted putative alternatively spliced exons. PCR experiments revealed that five of these exons were alternatively spliced, and that each of the four phosphatases incorporated them differently. The greatest variability in genomic organization and the majority of alternatively spliced exons were observed in the juxtamembrane domain, a region critical for the regulation of signal transduction.

Conclusions: Comparison of the four R2B RPTP genes revealed virtually identical principles of genomic organization, despite great disparities in gene size due to variations in intron length. Although subtle differences in exon length were also observed, it is likely that functional differences among these genes arise from the specific combinations of exons generated by alternative splicing.


Figures

Figure 1
Figure 1
Classification of receptor-like protein tyrosine phosphatases (RPTPs) into eight subfamilies (R1-R8), based on sequence similarity among PTP catalytic domains [3]. PTPμ, κ, ρ and PCP-2 are members of the R2B subfamily.
Figure 2
Figure 2
Organization of the murine PTPρ gene based on Celera genomic sequences. Left to right: Exon number, 3' splice site, exon sequence, 5' splice site, nucleotide number, exon size, intron size, intron phases and protein domain are shown. Amino acids (standard one letter code) are listed below the encoding nucleotides. D1 and D2 represent the first and second phosphatase domains, respectively; a to i designations indicate the individual exons within a single domain.
Figure 3
Figure 3
Organization of the murine PTPμ gene based on Celera genomic sequences. Left to right: Exon number, 3' splice site, exon sequence, 5' splice site, nucleotide number, exon size, intron size, intron phases and protein domain are shown. Amino acids (standard one letter code) are listed below the encoding nucleotides. D1 and D2 represent the first and second phosphatase domains, respectively; a to i designations indicate the individual exons within a single domain.
Figure 4
Figure 4
Organization of the murine PTPκ gene based on Celera genomic sequences. Left to right: Exon number, 3' splice site, exon sequence, 5' splice site, nucleotide number, exon size, intron size, intron phases and protein domain. Amino acids are listed below the encoding nucleotides. D1 and D2 represent the first and second phosphatase domains, respectively; a to i designations indicate the individual exons within a single domain.
Figure 5
Figure 5
Organization of the murine PCP-2 gene based on Celera genomic sequences. Left to right: Exon number, 3' and 5' splice sites, nucleotide number, exon size, intron size, intron phases and protein domain are shown. Amino acids (standard one letter code) are listed below the encoding nucleotides. D1 and D2 represent the first and second phosphatase domains, respectively; a to i designations indicate the individual exons within a single domain. **Exon not transcribed in brain.
Figure 6
Figure 6
Genomic organization of the murine RPTP R2B genes. Exons are shown as vertical bars and introns as thin horizontal lines drawn to different scales (indicated by scale bars). The size of the genomic regions encoding the extracellular and intracellular segments of each gene is not drawn proportionally. Note that exon distribution and clustering is similar for each gene.
Figure 7
Figure 7
Pairwise percentage nucleotide identity of individual exons. Exons 2–31 of the four murine R2B genes were compared in a pairwise fashion. Exon numbers are listed on the x axis, and the corresponding percentage identity for that exon is shown on the y axis. Three distinct regions may be discerned: The extracellular (exons 2–13), juxtamembrane (exons 14–18) and phosphatase (exons 19–32) domains.
Figure 8
Figure 8
Exon sizes within the murine R2B extracellular and juxtamembrane domains. Boxed numbers indicate the number of nucleotides in each exon; interconnecting horizontal lines represent introns (neither are to scale). The numbers between exons indicate intron phases. Note the variation in exon utilization in the trans (tm) -and juxtamembrane (jm) region.
Figure 9
Figure 9
Type R2B gene expression in the adult mouse brain. In situ hybridization using digoxigenin-labeled riboprobes was used to localize the four R2B phosphatases in sagittal sections of a P180 male C57BL/6 mouse brain. PTPρ (A-E), PTPμ (F-J), PTPκ (K-O), and PCP-2 (P-T) transcripts were present in various regions of the CNS including the olfactory bulb, cortex, hippocampus, and cerebellum. Olfactory bulb: ac, anterior commissure; g, granule layer; m, mitral cell layer; gl, glomerular layer; epl, external plexiform layer. Cortex: cortical layers I-VI. Hippocampus: d, dentate gyrus; h, hilus; or, oriens layer; py, pyramidal layer; r, radiatum layer; GII, Golgi II neurons. Cerebellum: dcn, deep cerebellar nuclei; ml, molecular layer; P, Purkinje cell layer; g, granule cell layer; G, Golgi cells. Arrowhead (D) shows anterior-posterior cerebellar boundary. Scale bars: Columns 1, 2 and 3 = 50 μm; column 4 = 500 μm; column 5 = 100 μm.
Figure 10
Figure 10
Murine R2B phylogenetic relationships. Parsimony tree constructed from full-length sequences of mouse R2B cDNAs. PTPρ and PTPμ are most closely related.
Figure 11
Figure 11
Alternative splicing of PTPρ mRNA. RT-PCR products were amplified using primers flanking exon 14 (panels A and B), exon 16 (panels C and D) and exon 22a (panels E and F). Left panels: bands in lanes 1, 2, and 3 are from human fetal brain, mouse P1 brain, and mouse P60 brain total RNA, respectively. Right panels: bands in lanes 4, 5, 6 and 7 contain total RNA from cerebellum, brain stem, basal forebrain and cortex (P23), respectively. Transcripts containing both splice forms of exons 14, 16 and 22a were found in all lanes.
Figure 12
Figure 12
Alternative splicing of PTPμ mRNA. RT-PCR products were amplified using primers flanking exon 14. Panel A: Bands in lanes 1, 2, and 3 are from human fetal brain, mouse P1 brain, and mouse P60 brain total RNA, respectively. Panel B: Bands in lanes 4, 5, 6 and 7 contain total RNA from P23 cerebellum, brain stem, basal forebrain and cortex, respectively. Transcripts containing both splice forms were found in all lanes.
Figure 13
Figure 13
Alternative splicing of PTPκ mRNA. RT-PCR products were amplified using primers flanking exon 16 (panels A and B), exon 17a (panels C and D) and exon 20a (panels E and F). Left panels: bands in lanes 1, 2, and 3 are from human fetal brain, mouse P1 brain, and mouse P60 brain total RNA, respectively. Right panels: bands in lanes 4, 5, 6 and 7 contain total RNA from cerebellum, brain stem, basal forebrain and cortex (P23), respectively. Transcripts containing both splice forms of exons 16 and 20a were found in all lanes.
Figure 14
Figure 14
Alternative splicing of PCP-2 mRNA. RT-PCR products were amplified using primers flanking exon 17a (panels A and B), exon 20a (panels C and D) and exon 22a (panels E and F). Left panels: bands in lanes 1, 2, and 3 are from human fetal brain, mouse P1 brain, and mouse P60 brain total RNA, respectively. Right panels: bands in lanes 4, 5, 6 and 7 contain total RNA from cerebellum, brain stem, basal forebrain and cortex (P23), respectively. Transcripts containing both splice forms of exons 17a, 20a, and 22a were found in all lanes.

References

    1. Sun Q, Schindelholz B, Knirr M, Schmid A, Zinn K. Complex genetic interactions among four receptor tyrosine phosphatases regulate axon guidance in Drosophila. Mol Cell Neurosci. 2001;17:274–291. doi: 10.1006/mcne.2000.0939. - DOI - PubMed
    1. Schindelholz B, Knirr M, Warrior R, Zinn K. Regulation of CNS and motor axon guidance in Drosophila by the receptor tyrosine phosphatase DPTP52F. Development. 2001;128:4371–82. - PubMed
    1. Andersen JN, Mortensen OH, Peters GH, Drake PG, Iversen LF, Olsen OH, Jansen PG, Andersen HS, Tonks NK, Moller NPH. Structural and evolutionary relationships among protein tyrosine phosphatase domains. Mol Cell Biol. 2001;21:7117–7136. doi: 10.1128/MCB.21.21.7117-7136.2001. - DOI - PMC - PubMed
    1. Johnson KG, Van Vactor D. Receptor protein tyrosine phosphatases in nervous system development. Physiol Rev. 2003;83:1–24. - PubMed
    1. Beckmann G, Bork P. An adhesive domain detected in functionally diverse receptors. TIBS. 1993;18:40–41. doi: 10.1016/0968-0004(93)90049-S. - DOI - PubMed

Publication types

MeSH terms