. 2004 Apr;86(4):1873-89.
doi: 10.1016/S0006-3495(04)74254-X.

Dynamic water networks in cytochrome C oxidase from Paracoccus denitrificans investigated by molecular dynamics simulations

Affiliations

Dynamic water networks in cytochrome C oxidase from Paracoccus denitrificans investigated by molecular dynamics simulations

Elena Olkhova et al. Biophys J. 2004 Apr.

Abstract

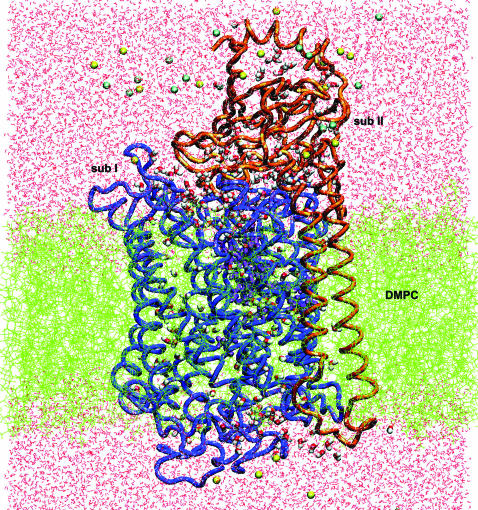
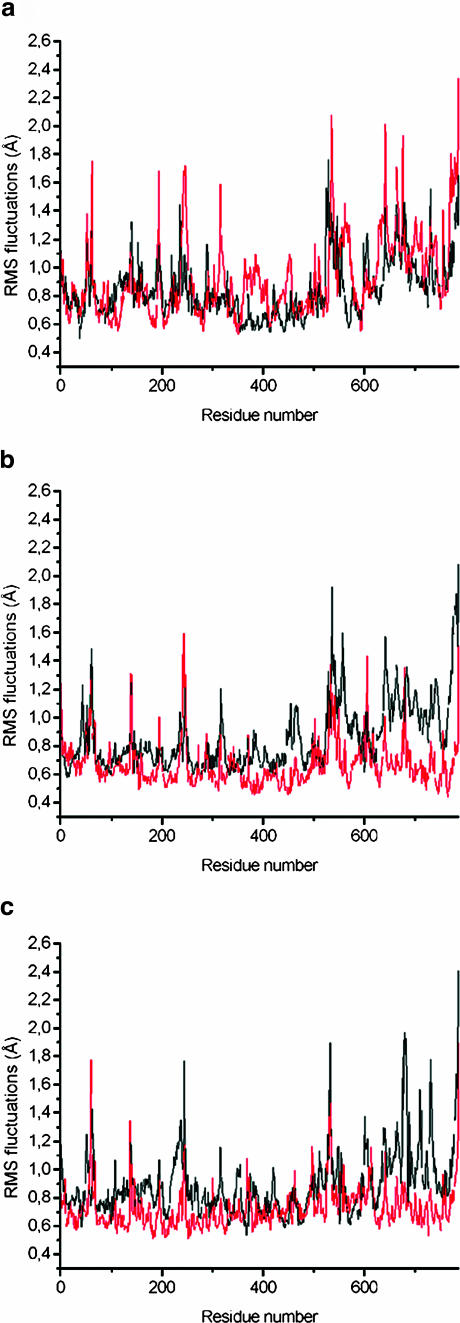
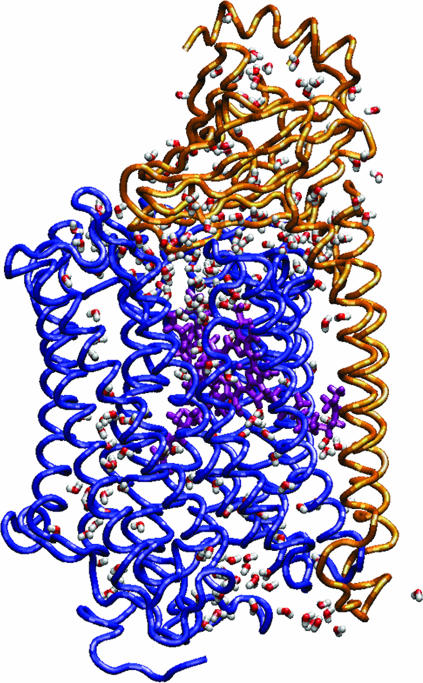
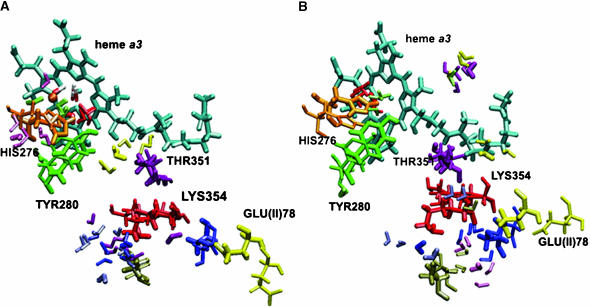
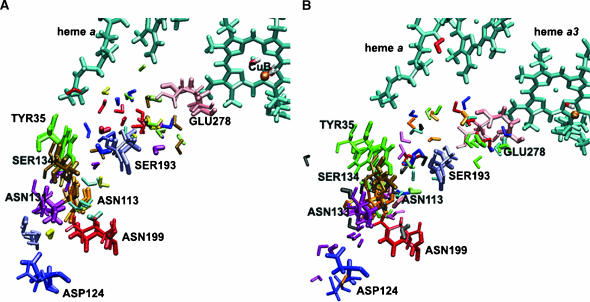
We present a molecular dynamics study of cytochrome c oxidase from Paracoccus denitrificans in the fully oxidized state, embedded in a fully hydrated dimyristoylphosphatidylcholine lipid bilayer membrane. Parallel simulations with different levels of protein hydration, 1.125 ns each in length, were carried out under conditions of constant temperature and pressure using three-dimensional periodic boundary conditions and full electrostatics to investigate the distribution and dynamics of water molecules and their corresponding hydrogen-bonded networks inside cytochrome c oxidase. The majority of the water molecules had residence times shorter than 100 ps, but a few water molecules are fixed inside the protein for up to 1.125 ns. The hydrogen-bonded network in cytochrome c oxidase is not uniformly distributed, and the degree of water arrangement is variable. The average number of solvent sites in the proton-conducting K- and D-pathways was determined. In contrast to single water files in narrow geometries we observe significant diffusion of individual water molecules along these pathways. The highly fluctuating hydrogen-bonded networks, combined with the significant diffusion of individual water molecules, provide a basis for the transfer of protons in cytochrome c oxidase, therefore leading to a better understanding of the mechanism of proton pumping.


Figures

FIGURE 1
FIGURE 1
(A) Partial atomic charges for the fully oxidized heme a/heme a3 derived from quantum chemical calculations. (B) Partial atomic charges for Tyr-280–His-276 crosslink (charges for His-276 are listed in C); (C) partial atomic charges for the histidine ligands to CuB. The charges on His-326 were restrained to be identical to those of His-325 and therefore not shown. (D) Partial atomic charges for the histidine ligand to Fe atom of heme a3. (E) Partial atomic charges for histidine ligands to Fe atom of heme a; the two His ligands carry the same charges.
FIGURE 2
FIGURE 2
Simulation system setup (side view): two-subunits of cytochrome c oxidase embedded in a DMPC membrane solvated by a 100 mM NaCl aqueous salt solution (the Na+ ions are yellow and the Cl ions are blue). The snapshot was taken at the beginning of the molecular dynamics production phase after 575 ps of equilibration for the W12 set.
FIGURE 3
FIGURE 3
Root mean-square deviation (RMSD) relative to the x-ray structure as a function of time, calculated over all backbone atoms (black line), side-chain atoms (gray line), and heme a/a3 atoms (light gray). (A) RMSD from the W12 set of coordinates; (B) RMSD from the W8 set.
FIGURE 4
FIGURE 4
RMSF of the backbone atoms calculated from the molecular dynamics trajectories at 1–45 ps (black line), 450–495 ps (red line), 1080–1125 ps (green line), and from the experimental B-factor (blue line). All values are averaged over the individual amino acids. (a) RMSF from the W12 set. (b) RMSF from the W8 set.
FIGURE 5
FIGURE 5
RMSF of the backbone atoms calculated from the molecular dynamics trajectories for the W12 and W8 sets of water molecules during 1–45 ps (a), 450–495 ps (b), and 1080–1125 ps (c). All values are averaged over the individual amino acids; the backbone atoms from the W12 set of coordinates are shown in black; the backbone atoms from the W8 set of coordinates are shown in red.
FIGURE 6
FIGURE 6
The distribution of water molecules in the COX during the simulation.
FIGURE 7
FIGURE 7
Multiple configurations of selected residues and water molecules in the K-pathway for the W12 (A) and W8 (B) set of coordinates observed from MD trajectories. Initial coordinates are shown with the thick licorice. Positions of the selected residues after 1125 ps are shown with the thin licorice. Snapshots for selected water molecules are taken after 225, 450, 675, 900, and 1125 ps of simulations. For the W12 set of coordinates water molecule WS6 (structural water) is represented in blue, WS9 in yellow, WS69 in red, WS81 in rose, WG7 (internal GRID water) in light green, WG149 in pink, and WG161 in magenta. For the W8 set of coordinates water molecule WS6 is represented in blue, WS69 in red, WS88 in yellow, WG13 in rose, WG188 in light green, WG194 in gold, WG379 in pink, WG491 in magenta, and W26484 in orange.
FIGURE 8
FIGURE 8
Multiple configurations of selected residues and water molecules in the D-pathway for the W12 (A) and W8 (B) set of coordinates observed from MD trajectories. Initial coordinates are shown with the thick licorice. Positions of the selected residues after 1125 ps of MD run are shown with the thin licorice. Snapshots for selected water molecules are taken after 225, 450, 675, 900, and 1125 ps of simulations. For the W12 set of coordinates water molecule WS38 is represented in blue, WS40 in yellow, WS80 in red, WG8 in light green, WG12 in gold, WG80 in light blue, WG131 in magenta, and WG144 in pink. For the W8 set of coordinates water molecule WS3 is represented in rose, WS38 in blue, WG9 in light blue, WG11 in orange, WG180 in light green, WG198 in magenta, WG220 in green, WG238 in red, WG540 in gray, and W1232 in black.
FIGURE 9
FIGURE 9
Multiple configurations of selected residues and water molecules close to the heme a/heme a3–CuB region for the W12 (A) and W8 (B) set of coordinates observed from MD trajectories. Initial coordinates are shown with the thick licorice. Positions of the selected residues after 1125 ps of MD run are shown with the thin licorice. Snapshots for selected water molecules are taken after 225, 450, 675, 900, and 1125 ps of simulations. For the W12 set of coordinates water molecule WS13 is represented in blue, WS69 in red, WG5 in yellow, WG7 in green, WG30 in pink, WG144 in magenta, WG173 in orange, W4172 in gold, and W4214 in rose. For the W8 set of coordinates water molecule WS13 is represented in blue, WS14 in yellow, WS69 in red, WG31 in light green, WG42 in orange, WG46 in magenta, WG51 in pink, WG157 in green, WG188 in rose, WG189 in black, and WG453 in gold.

References

    1. Aagaard, A., G. Gilderson, D. A. Mills, S. Ferguson-Miller, and P. Brzezinski. 2000. Redesign of the proton-pumping machinery of cytochrome c oxidase: proton pumping does not require Glu(I-286). Biochemistry. 39:15847–15850. - PubMed
    1. Babcock, G. T., and M. Wikström. 1992. Oxygen activation and the conservation of energy in cell respiration. Nature. 356:301–309. - PubMed
    1. Backgren, C., G. Hummer, M. Wikström, and A. Puustinen. 2000. Proton translocation by cytochrome c oxidase can take place without the conserved glutamic acid in subunit I. Biochemistry. 39:7863–7867. - PubMed
    1. Berneche, S., M. Nina, and B. Roux. 1998. Molecular dynamics simulation of melittin in a dimyristoylphosphatidylcholine bilayer membrane. Biophys. J. 75:1603–1618. - PMC - PubMed
    1. Berneche, S., and B. Roux. 2000. Molecular dynamics of the KcsA K+ channel in a bilayer membrane. Biophys. J. 78:2900–2917. - PMC - PubMed

Publication types

LinkOut - more resources