. 2004 Apr;86(4):2342-9.
doi: 10.1016/S0006-3495(04)74291-5.

Chlamydomonas sensory rhodopsins A and B: cellular content and role in photophobic responses

Affiliations

Chlamydomonas sensory rhodopsins A and B: cellular content and role in photophobic responses

Elena G Govorunova et al. Biophys J. 2004 Apr.

Abstract

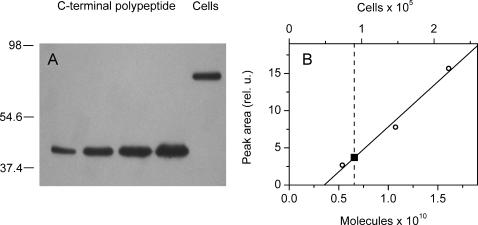
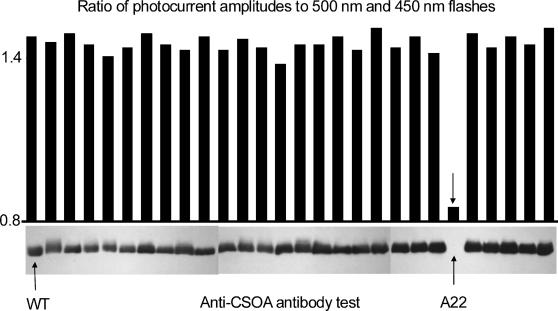
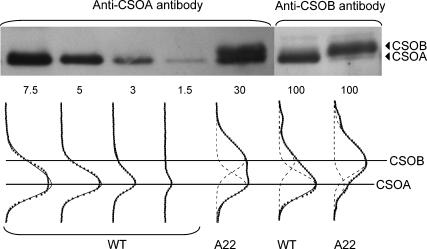
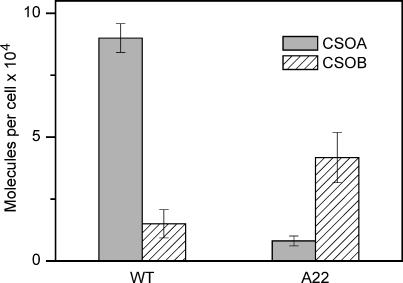
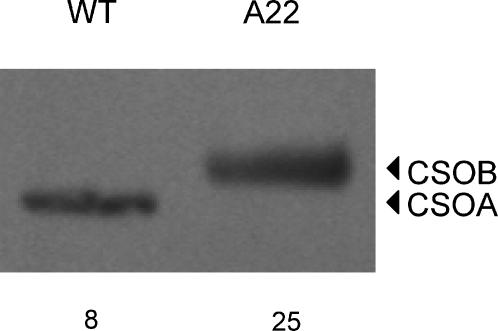
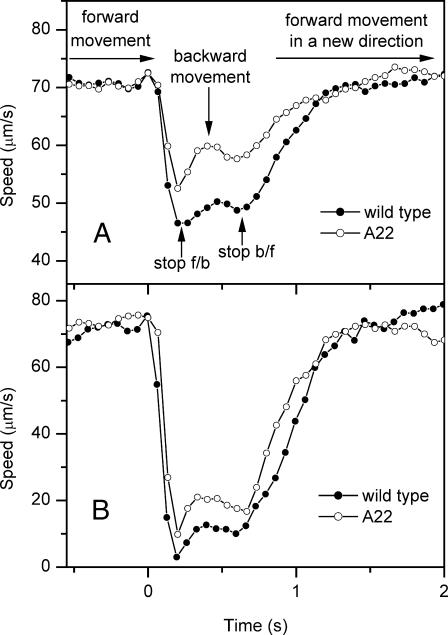
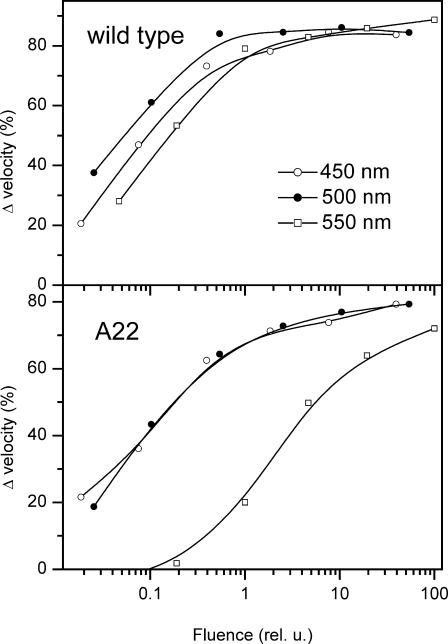
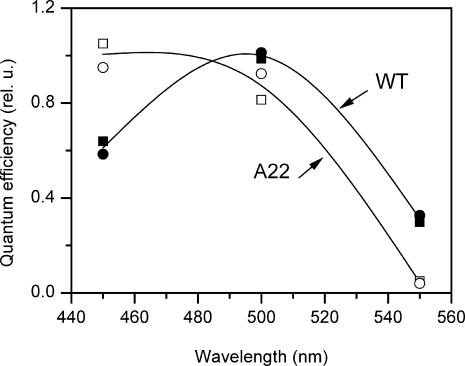
Two retinylidene proteins, CSRA and CSRB, have recently been shown by photoelectrophysiological analysis of RNAi-transformants to mediate phototaxis signaling in Chlamydomonas reinhardtii. Here we report immunoblot detection of CSRA and CSRB apoproteins in C. reinhardtii cells enabling assessment of the cellular content of the receptors. We obtain 9 x 10(4) CSRA and 1.5 x 10(4) CSRB apoprotein molecules per cell in vegetative cells of the wild-type strain 495, a higher value than that for functional receptor cellular content estimated previously from photosensitivity measurements and retinal extraction yields. Exploiting our ability to control the CSRA/CSRB ratio by transformation with receptor gene-directed RNAi, we report analysis of the CSRA and CSRB roles in the photophobic response of the organism by action spectroscopy with automated cell tracking/motion analysis. The results show that CSRA and CSRB each mediate the photophobic swimming response, a second known retinal-dependent photomotility behavior in C. reinhardtii. Due to the different light saturation and spectral properties of the two receptors, CSRA is dominantly responsible for photophobic responses, which appear at high light intensity.


Figures

FIGURE 1
FIGURE 1
Quantitation of the cellular content of CSOA in the wild-type C. reinhardtii. (A) Immunoblot of C-terminal polypeptide serial dilutions and a whole-cell extract. Positions of molecular weight markers in kDa are shown to the left. (B) Densitometric analysis of the blot data; (○, bottom abscissa) C-terminal polypeptide (data points in the linear range are shown); (▪, top abscissa) cell extract. For presentation purposes, the image shown in A was taken from the same membrane after a longer exposure than that used for the quantitative analysis.
FIGURE 2
FIGURE 2
Selection of CSRA-RNAi transformants of C. reinhardtii. (Top) Ratio of amplitudes of photoreceptor currents elicited by flashes of 500 and 450 nm. (Bottom) Immunoblots of cell extracts treated with the anti-CSOA antibody.
FIGURE 3
FIGURE 3
Comparative immunoblot analysis of CSOA and CSOB in the wild-type and CSRA-RNAi transformant A22. (Top) Immunoblots of cell extracts treated with the anti-CSOA or anti-CSOB antibody; the amount of total protein per lane in micrograms is indicated below the image. (Bottom) Density profiles of the blots (solid squares) and their fit with asymmetric Gaussian functions (dashed lines, individual peaks; solid lines, superposition of the peaks).
FIGURE 4
FIGURE 4
The absolute amounts of CSOA and CSOB in the wild-type and CSRA-RNAi transformant A22. Error bars represent mean ± SE of three to six independent measurements.
FIGURE 5
FIGURE 5
Immunodetection of CSOA and CSOB in gametes of the wild-type and CSRA-RNAi transformant A22 with the anti-CSOA antibody. The amount of total protein loaded per lane in micrograms is indicated below the image.
FIGURE 6
FIGURE 6
Kinetics of changes in average velocity of cell movement during photophobic responses in the wild-type (solid symbols) and CSRA-RNAi transformant A22 (open symbols). Excitation with a nonsaturating flash (A) and at the maximal available fluence of the flash (B) at zero time.
FIGURE 7
FIGURE 7
Fluence-response curves for photophobic responses to stimulation with three broad spectral bands in the wild-type (top panel) and CSRA-RNAi transformant A22 (bottom panel).
FIGURE 8
FIGURE 8
Spectral sensitivity of the photophobic response in the wild-type (solid symbols) and CSRA-RNAi transformant A22 (open symbols). Results of two independent experiments for each strain are indicated by the symbol type. Data were normalized to the mean sensitivity at the most efficient spectral band.

References

    1. Beck, C., and R. Uhl. 1994. On the localization of voltage-sensitive calcium channels in the flagella of Chlamydomonas reinhardtii. J. Cell Biol. 125:1119–1125. - PMC - PubMed
    1. Beckmann, M., and P. Hegemann. 1991. In vitro identification of rhodopsin in the green alga Chlamydomonas. Biochemistry. 30:3692–3697. - PubMed
    1. Crescitelli, F., T. W. James, J. M. Erickson, E. R. Loew, and W. N. McFarland. 1992. The eyespot of Chlamydomonas reinhardtii: a microspectrophotometric study. Vision Res. 32:1593–1600. - PubMed
    1. Ebrey, T. G. 2002. A new type of photoreceptor in algae. Proc. Natl. Acad. Sci. USA. 99:8463–8464. - PMC - PubMed
    1. Fischer, N., and J.-D. Rochaix. 2001. The flanking regions of PsaD drive efficient gene expression in the nucleus of the green alga Chlamydomonas reinhardtii. Mol. Genet. Genomics. 265:888–894. - PubMed

Publication types

LinkOut - more resources