. 2004 Apr 6;101(14):5053-7.
doi: 10.1073/pnas.0305375101. Epub 2004 Mar 24.

Infraslow oscillations modulate excitability and interictal epileptic activity in the human cortex during sleep

Affiliations

Infraslow oscillations modulate excitability and interictal epileptic activity in the human cortex during sleep

S Vanhatalo et al. Proc Natl Acad Sci U S A. .

Abstract

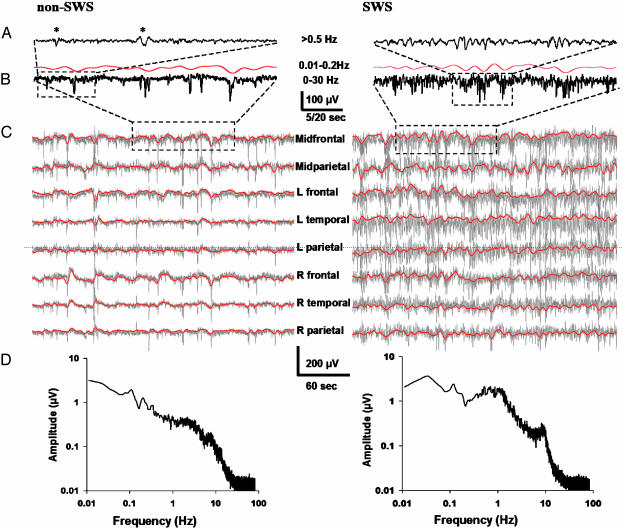
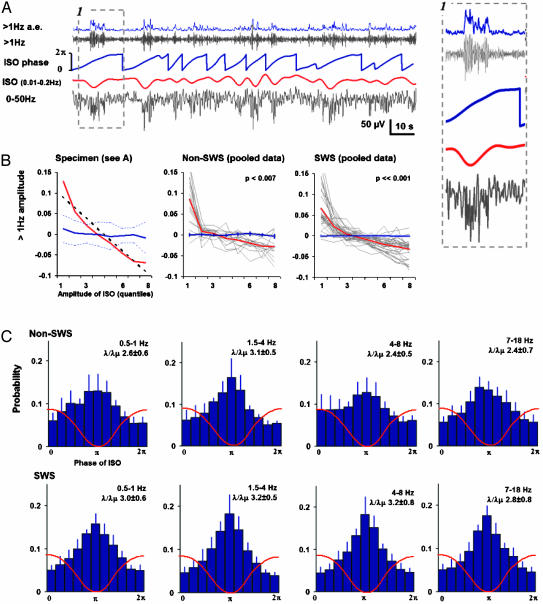
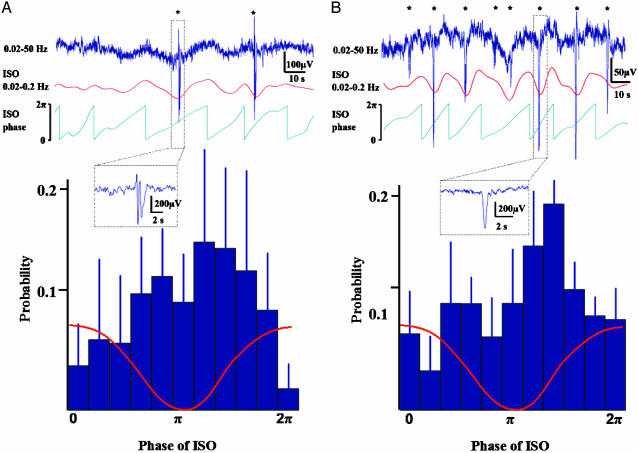
Human cortical activity has been intensively examined at frequencies ranging from 0.5 Hz to several hundred Hz. Recent studies have, however, reported also infraslow fluctuations in neuronal population activity, magnitude of electroencephalographic oscillations, discrete sleep events, as well as in the occurrence of interictal events. Here we use direct current electroencephalography to demonstrate large-scale infraslow oscillations in the human cortex at frequencies ranging from 0.02 to 0.2 Hz. These oscillations, which are not detectable in conventional electroencephalography because of its limited recording bandwidth (typical lower limit 0.5 Hz), were observed in widespread cortical regions. Notably, the infraslow oscillations were strongly synchronized with faster activities, as well as with the interictal epileptic events and K complexes. Our findings suggest that the infraslow oscillations represent a slow, cyclic modulation of cortical gross excitability, providing also a putative mechanism for the as yet enigmatic aggravation of epileptic activity during sleep.


Figures

Fig. 1.
Fig. 1.
Infraslow oscillations during non-SWS (Left) and SWS (Right). (A) High-pass-filtered (>0.5 Hz; 30 s long) epoch during sleep. Asterisks depict K complexes. (B) A prominent infraslow oscillation is readily seen in the 2-min epoch in the full-bandwidth EEG signal (black), as well as with bandpass filtering at 0.01-0.2 Hz (red). (C) Five-minute recordings from various scalp locations demonstrates ISOs in all of them (gray traces at full bandwidth, superimposed red traces with bandpass filtering at 0.01-0.2Hz). (D) Amplitude spectra for non-SWS and SWS, representing averages of three 180-s segments (90-s Hanning window; 60-Hz mains artifact removed) from one representative subject each. In all figures, EEG traces are shown against a calculated linked mastoid reference, and negative deflections are downward.
Fig. 2.
Fig. 2.
Correlation between ISOs and faster EEG oscillations. (A) Extraction of infraslow (red) and faster oscillations using bandpass filtering (upper gray trace shows an example with high-pass filtering at 1 Hz). The amplitude envelope of the faster oscillations (a.e.; blue trace, Top) and the phase of ISO (blue trace, Middle) were obtained with the Hilbert transform. A blown-up figure of one ISO cycle (stippled line box) is demonstrated on the right side of the traces. (B) Correlation histogram for the epoch in A (Left), demonstrating that the instantaneous level of ISO voltage is clearly correlated with the (normalized) amplitude envelope of the >1 Hz band. Red line depicts the correlation histogram, the thick blue stippled line depicts its linear regression, and the solid blue line depicts surrogate data with the thin blue stippled lines representing its ± 2 SD confidence intervals. The two other graphs (Center and Right) show the correlation histograms for all sleep epochs analyzed from non-SWS and SWS (gray lines depict individual epochs, red is their average, and the blue line represents the mean of the surrogates (±SEM). (C) Histograms demonstrating that the amplitudes in all frequency bands (as indicated in each plot) are strongly correlated with the phase (x axis) of ISO during both non-SWS (Upper) and SWS (Lower). A schematic ISO wave is superimposed on the histograms. Values next to λ/λμ are the PLFreal/PLFshuffled,mean ratios (±SEM) averaged over subjects, indicating the statistical significance of the phase locking. (λ/λμ > 2.41 corresponds to P < 0.01, and λ/λμ > 2.94 corresponds to P < 0.001 in individual subjects.)
Fig. 3.
Fig. 3.
Phase locking of interictal events (A) and K complexes (B) to infraslow oscillations. Traces in the upper part demonstrate 2 min epochs of the raw data (blue traces on top) during non-SWS with repeated interictal spikes and K complexes (see the Insets in A and B, respectively), as well as the bandpass-filtered ISO (red) and its phase (green). In the histograms, the occurrence of IIEs (n = 238; six subjects) and K complexes (n = 383; seven subjects) is plotted against the phase of ISO, revealing highly significant locking of both phenomena to the phase of ISO. A schematic ISO wave is superimposed on the histograms.

References

    1. Niedermeyer, E. & Lopes da Silva, F., eds. (1999) Electroencephalography: Basic Principles, Clinical Applications, and Related Fields (Williams & Wilkins, Baltimore).
    1. Leopold, D. A., Murayama, Y. & Logothetis, N. I. (2003) Cereb. Cortex 13, 422-433. - PubMed
    1. Staba, R. J., Wilson, C. L., Bragin, A., Fried, I. & Engel, J., Jr. (2002) J. Neurosci. 22, 5694-5704. - PMC - PubMed
    1. Penttonen, M., Nurminen, N., Miettinen, R., Sirvio, J., Henze, D. A., Csicsvari, J. & Buzsaki, G. (1999) Neuroscience 94, 735-743. - PubMed
    1. Steriade, M., Nunez, A. & Amzica, F. (1993) J. Neurosci. 13, 3252-3265. - PMC - PubMed

Publication types