. 2004 Apr 13;101(15):5610-5.
doi: 10.1073/pnas.0308054101. Epub 2004 Mar 25.

Selective expression of IL-7 receptor on memory T cells identifies early CD40L-dependent generation of distinct CD8+ memory T cell subsets

Affiliations

Selective expression of IL-7 receptor on memory T cells identifies early CD40L-dependent generation of distinct CD8+ memory T cell subsets

Katharina M Huster et al. Proc Natl Acad Sci U S A. .

Abstract

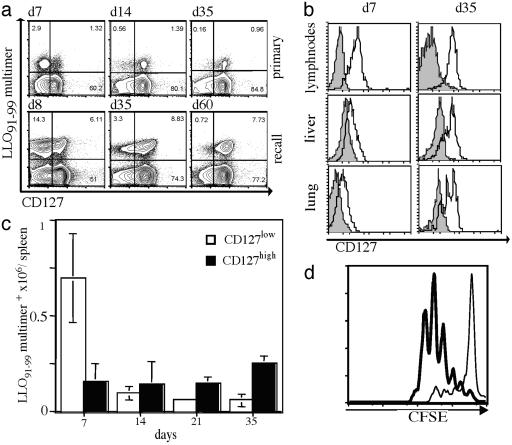
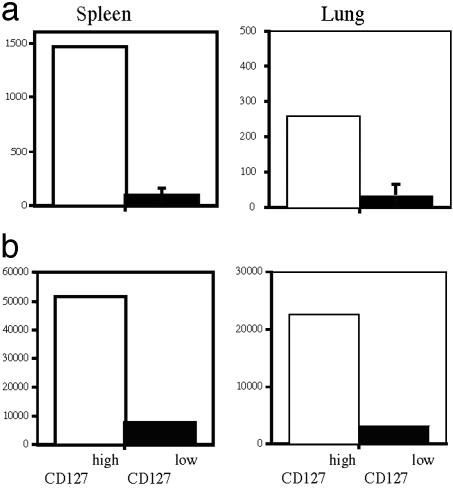
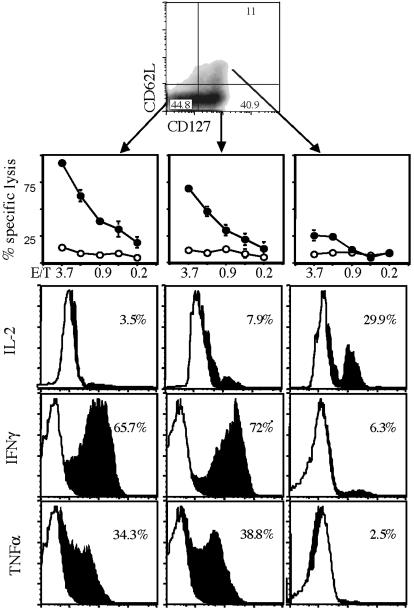
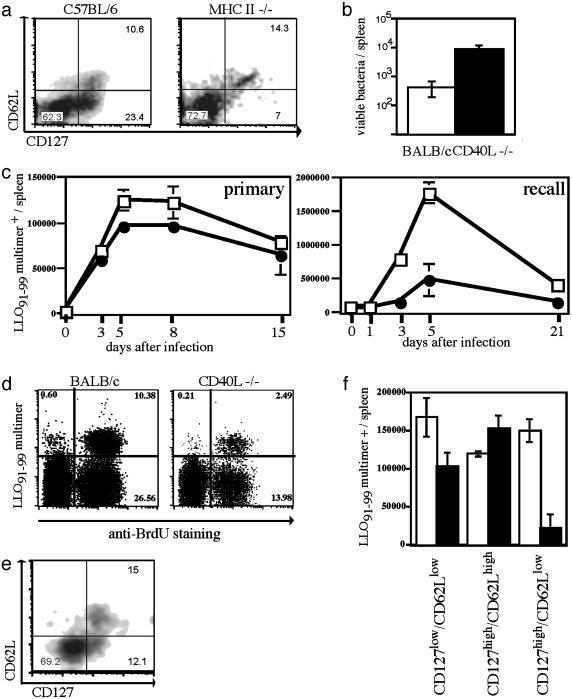
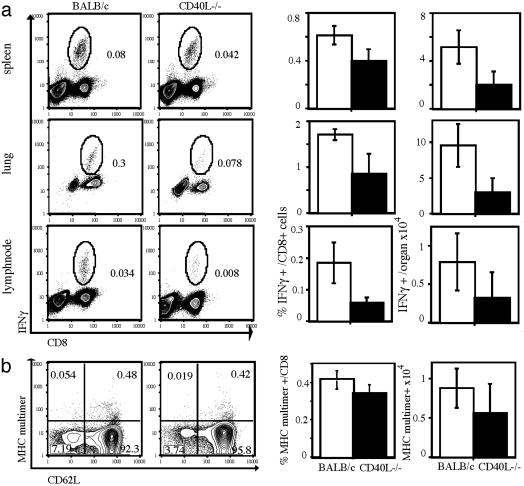
Several recent studies have demonstrated that T-helper cell-dependent events during the initial priming period are required for the generation of CD8(+) T cell-mediated protective immunity. The underlying mechanisms of this phenomenon have not yet been determined, mostly because of difficulties in studying memory T cells or their precursor populations at early stages during immune responses. We identified IL-7 receptor (CD127) surface expression as a marker for long-living memory T cells, most importantly allowing the distinction between memory and effector T cells early after in vivo priming. The combination of surface staining for CD127 and CD62L further separates between two functionally distinct memory cell subsets, which are similar (if not identical) to cell subsets recently described as central memory T cells (CD127(high) and CD62L(high)) and peripheral effector memory T cells (CD127(high) and CD62L(low)). Using this new tool of memory T cell analysis, we demonstrate that CD8(+) T cell priming in the absence of T cell help or CD40L specifically alters the generation of the effector memory T cell subset, which appears to be crucial for immediate memory responses and long-term maintenance of effective protective immunity. Our data reveal a unique strategy to obtain information about the quality of long-term protective immunity early during an immune response, a finding that may be applied in a variety of clinical settings, including the rapid monitoring of vaccination success.


Figures

Fig. 1.
Fig. 1.
CD127 (IL-7R) surface expression as a marker for memory T cells. (a) A cohort of BALB/c mice was infected with a sublethal dose (≈0.1 × LD50) of WT Lm, followed by secondary infection (≈10 × LD50) 5 wk later. Representative dot plots of splenocytes (gated on live CD8+ T cells) stained with H2-Kd/ LLO91–99 tetramers (y axis) and for CD127 surface expression (x axis) are shown for the indicated time points during primary (Upper) and recall (Lower) responses. (b) Lymphocytes from different organs were isolated during the primary effector (7 days after infection) and memory (35 days after infection) phases. Representative histograms are gated on CD8+ and H2-Kd/ LLO91–99 tetramer-positive cells and show CD127 staining (open) and unstained controls (filled). (c) Kinetics of the absolute numbers (y axis) of CD127 high-(filled) and low (open)-expressing CD8+ and H2-Kd/LLO91–99 tetramer-positive cells; six individual mice per time point. (d) CD127 high- and low-expressing CD8+, H2-Kd/LLO91–99 multimer-positive cells were sorted directly ex vivo 10 days after Listeria infection. Proliferation of carboxy fluorescein succinimidyl ester-labeled cells was analyzed after anti-CD3 stimulation; CD127high (bold line) or CD127low (thin line) cells.
Fig. 2.
Fig. 2.
Adoptive transfer studies indicate that long-living memory T cells are exclusively present in the CD127-positive compartment. CD127 high- and low-expressing CD8+, H2-Kd/LLO91–99 multimer-positive cells from BALB/c Thy1.1 mice were sorted directly ex vivo 10 days after Listeria infection. Cells were transferred into naive BALB/c (Thy1.2)-recipient mice, and 3 wk later spleens and lungs were stained for donor cells (CD8+ and Thy1.1+). (a) Bar graphs summarize data for absolute numbers of Thy1.1+ cells per organ after transfer of CD127high cells (open) or CD127low (filled) T cells. (b) Same data acquisition and data presentation as described in a, 5 days after infection with 103 Lm.
Fig. 3.
Fig. 3.
CD127/CD62L double staining distinguishes between distinct CD8+ T cell subsets; similar results can be found in humans. Double staining of CD8+, H2-Kd/LLO91–99 multimer-positive cells for surface expression of CD62L (y axis) and CD127 (x axis) after infection with Lm; relative percentages of subpopulations in quadrants are indicated. CD127low/CD62Llow, CD127high/CD62Llow, and CD127high/CD62Lhigh subpopulations were sorted directly ex vivo 12 days after Listeria infection and transferred into different functional assays. Cytolytic activity was assessed after incubation of sorted cells in the presence of target cells and LLO91–99 peptide (squares) or no peptide (circles). Intracellular cytokine staining of ex vivo sorted LLO91–99-specific subpopulations (as indicated above) was performed for IL-2 (Top), IFN-γ (Middle), and tumor necrosis factor α (Bottom) after brief in vitro restimulation with LLO91–99 peptide (black areas; white areas represent unstimulated controls); percentages of cytokine-positive cells are indicated.
Fig. 4.
Fig. 4.
Impaired memory responses in MHC II–/– and CD40L–/– mice correlate with early defects in the generation of distinct T cell subsets. (a) WT C57BL/6 (Left) and MHC II-deficient (Right) mice were infected with a sublethal dose of ovalbumin-expressing Lm; dot plots of CD8+, H2-Kb/SIINFEKL-positive T cells stained for CD62L (y axis) and CD127 (x axis) 10 days after primary infection are shown. (b) Numbers of viable bacteria in the spleen 3 days after reinfection (≈10 × LD50; 5 wk after primary infection) with Listeria in CD40L–/– (filled) and WT BALB/c (open); n = 3 per group. (c) Kinetics of LLO91–99-specific T cells determined by H2-Kd/LLO91–99 tetramer staining in CD40L–/– (•) or WT BALB/c mice (□) after primary (0.1 × LD50) and recall infection (2.5 × LD50; 5 wk after primary infection) with Lm; three mice per time point. (d) WT BALB/c mice and CD40L–/– mice received BrdUrd by drinking water during recall infection with Lm (2.5 × LD50; 5 wk after primary infection) during the entire expansion phase (days 1–5); dot plots show BrdUrd incorporation (x axis) in CD8+ T cells stained with H2-Kd/LLO91–99 tetramers (y axis), staining was performed on day 5. (e) Double staining of CD8+, H2-Kd/ LLO91–99 tetramer-positive cells from a CD40L–/– BALB/c mouse for CD62L (y axis) and CD127 (x axis) 10 days after primary infection (WT BALB/c control see Fig. 2c). (f) Absolute numbers of LLO91–99 tetramer-positive T cell subsets in the spleen determined 10 days after primary infection by staining for CD62L and CD127.
Fig. 5.
Fig. 5.
CD40L-dependent changes in T cell subsets early after T cell priming are transmitted into the subsequent memory T cell pool. (a) Lymphocytes were isolated from lungs, spleens, and LN derived from WT BALB/c mice or CD40L–/– 35 days after primary infection with Lm (0.1 × LD50). Intracellular IFN-γ staining was performed after brief in vitro restimulation in the presence of LLO91–99 peptide to identify T cells with immediate effector function. Dot plots show representative results for different organs (as indicated); numbers indicate the overall frequencies of IFN-γ-producing cells. The first row of bar graphs summarizes the data for frequencies of IFN-γ-producing, LLO91–99-specific T cells within the CD8+ compartment; the row of bar graphs to the right summarizes the data for absolute numbers of IFN-γ-producing, LLO91–99-specific T cells in different organs [CD40L–/– (filled) and WT BALB/c (open); n = 3 per group]. (b) LN cells were taken 35 days after primary infection as described in a; LLO91–99-specific T cells were detected by MHC multimer staining (dot plot, y axis) together with costaining for CD8 and CD62L (dot plot, x axis) surface expression. Representative dot plots are shown for cells gated on CD8+ T cells; frequencies within each quadrant are indicated. Bar graph to the left summarizes data for frequencies of MHCS multimer- and CD62L-positive T cells within the CD8+ compartment; the row of bar graph to the right summarizes the data for absolute numbers of LLO91–99/H2-Kd multimer-positive T cells in LN (CD40L–/– (filled) and WT BALB/c (open); n = 3 per group).

References

    1. Herrath, M. v., Yokoyama, M., Dockter, J., Oldstone, M. B. A. & Whitton, J. L. (1996) J. Virol. 70, 1072–1079. - PMC - PubMed
    1. Janssen, E. M., Lemmens, E. E., Wolfe, T., Christen, U., von Herrath, M. G. & Schoenberger, S. P. (2003) Nature 421, 852–856. - PubMed
    1. Sun, J. C. & Bevan, M. J. (2003) Science 300, 339–342. - PMC - PubMed
    1. Shedlock, D. J. & Shen, H. (2003) Science 300, 337–339. - PubMed
    1. Borrow, P., Tshon, A., Lee, S., Xu, J., Grewal, I. S., Oldstone, M. B. A. & Flavell, R. A. (1996) J. Exp. Med. 183, 2129–2142. - PMC - PubMed

Publication types

MeSH terms