. 2004 Apr;13(4):1108-23.
doi: 10.1110/ps.03468904.

HIV-1 protease molecular dynamics of a wild-type and of the V82F/I84V mutant: possible contributions to drug resistance and a potential new target site for drugs

Affiliations

HIV-1 protease molecular dynamics of a wild-type and of the V82F/I84V mutant: possible contributions to drug resistance and a potential new target site for drugs

Alexander L Perryman et al. Protein Sci. 2004 Apr.

Erratum in

  • Protein Sci. 2004 May;13(5):1434

Abstract

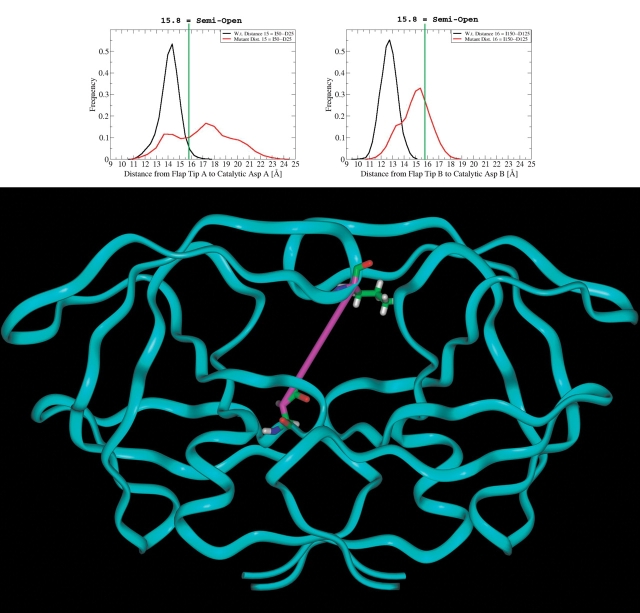
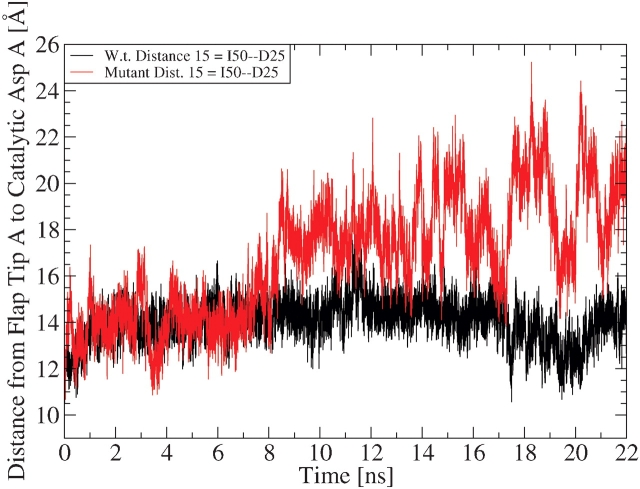
The protease from type 1 human immunodeficiency virus (HIV-1) is a critical drug target against which many therapeutically useful inhibitors have been developed; however, the set of viral strains in the population has been shifting to become more drug-resistant. Because indirect effects are contributing to drug resistance, an examination of the dynamic structures of a wild-type and a mutant could be insightful. Consequently, this study examined structural properties sampled during 22 nsec, all atom molecular dynamics (MD) simulations (in explicit water) of both a wild-type and the drug-resistant V82F/I84V mutant of HIV-1 protease. The V82F/I84V mutation significantly decreases the binding affinity of all HIV-1 protease inhibitors currently used clinically. Simulations have shown that the curling of the tips of the active site flaps immediately results in flap opening. In the 22-nsec MD simulations presented here, more frequent and more rapid curling of the mutant's active site flap tips was observed. The mutant protease's flaps also opened farther than the wild-type's flaps did and displayed more flexibility. This suggests that the effect of the mutations on the equilibrium between the semiopen and closed conformations could be one aspect of the mechanism of drug resistance for this mutant. In addition, correlated fluctuations in the active site and periphery were noted that point to a possible binding site for allosteric inhibitors.


Figures

Figure 1.
Figure 1.
Topology of HIV protease: The mutant side chains 82F and 84V are displayed in red stick mode, while all other side chains are not displayed. The cyan ribbon depicts the backbone of the mutant 1D4S.pdb, while the purple ribbon displays the backbone of the wild-type 1KZK.pdb (backbone RMSD = 0.76 Å). A possible new convention for the terminology of the topology of HIV protease is proposed that involves the following: Flap (43–58), Ear (35–42), Cheek (Cheek Turn = 11–22 and Cheek Sheet = 59–75), Eye (23–30), and Nose (6–10). Unlike the current convention, this new terminology is independent of any particular hypothesis of the mechanism of flap motion.
Figure 2.
Figure 2.
Root-mean-square deviation of the backbone atoms (i.e., N, α C, and carbonyl C) with respect to time. For qualitative comparisons, an RMSD of 1.75 Å was observed between certain semiopen and closed conformations in one published study.
Figure 3.
Figure 3.
Comparing the curling of the flap tips: The black line displays the curling behavior of wild-type monomer A’s flap tip, while the red line depicts the curling of the mutant’s flap tip. When a flap tip curls, its backbone geometry must change. To demonstrate curling behavior, the variability in the angle between the three α C’s of G48–G49–I50 is shown.
Figure 4.
Figure 4.
Curled-in vs. curled-out flap tips: Ribbon representations are shown of the two extrema from the largest flap opening event that occurred in the wild-type simulation. The snapshot from 17,505 psec is colored red, it has a I50 C α–D25 C β distance of 10.6 Å, and it has a value of 149° for TriCa Angle 6 (G48–G49–I50, which is colored white). Thus, the red ribbon is displaying the curled out state. The snapshot from 17,666 psec is colored violet, it has a I50 C α–D25 C β distance of 16.0 Å, and it has a value of 108° for TriCa Angle 6. Thus, the violet ribbon has its flap tip curled in.
Figure 5.
Figure 5.
Rapid curling behavior was displayed: The above seven ribbon diagrams depict a fast flap-opening event (3.0 Å displacement in 20 psec) that involved rapid curling behavior of the mutant’s flap tip. The snapshot from 4210 psec is colored orange, it has a I50 C α–D25 C β distance of 13.8 Å, and it has a value of 147° for TriCa Angle 6 (G48–G49–I50, which is colored white). The time points, flap–Asp distances, and TriCa Angle 6 values for the other images are as follows: 4214 psec in cyan, 14.9 Å, 120°; 4217 psec in light blue, 14.9 Å, 138°; 4225 psec in purple, 15.5 Å, 118°; 4226 psec in violet, 16.5 Å, 131°; 4227 psec in magenta, 15.5 Å, 114°; and 4228 psec in white, 14.9 Å, 135°. The displacement of flap A proceeded from 13.5 Å at 4206 psec to 16.5 Å at 4226 psec (see also Supplemental Material, Fig. 2 ▶).
Figure 6.
Figure 6.
Flap tip to catalytic asp distances: The black histograms represent the wild-type frequencies, while the red histograms display the drug-resistant V82F/I84V mutant’s frequencies. The graph on the left indicates the values that were sampled by the I50 C α–D25 C β distance during nsec 2–22, while the graph on the right signifies the values sampled for the I150 C α–D125 C β distance. The green line marks the I50–D25 distance value from the apo [semiopen] 1HHP.pdb structure; thus, any snapshot with an I50–D25 (or I150–D125) distance greater than or equal to 15.8 Å is defined as a snapshot in the semiopen conformation. For comparison, those distances in the closed crystallographic complexes were as follows: I50–D25 in 1KZK (w.t.) = 12.4 Å and in 1D4S = 12.1 Å; I150–D125 in 1KZK = 13.0 Å and in 1D4S = 12.1 Å. The ribbon diagram displays one of the flap tip-to-Asp distance measurements as a magenta stick.
Figure 7.
Figure 7.
Comparing the motion of monomer A’s flap: The black curve maps the trajectory of the wild-type’s distance from I50 C α to D25 C β, while the red curve shows the mutant’s flap tip-to-catalytic Asp distance trajectory. Any snapshot with an I50–D25 distance greater than or equal to 15.8 Å is defined as a snapshot in the semiopen conformation (according to the 1HHP.pdb crystal structure). To observe the motion of monomer B’s flap for these systems, see the Supplemental Material, Figure 3 ▶.
Figure 8.
Figure 8.
Global maxima for flap tip A-to-catalytic Asp 25 distances compared to a closed crystal structure: The cyan space-filling model depicts the mutant’s closed crystal structure (1D4S.pdb, with the ligand not displayed), the red space-filling image shows the mutant snapshot that sampled the largest distance from I50 C α to D25 C β (i.e., snapshot 18,282 psec, distance = 25.2 Å), the small ligand colored by atom type is the substrate KARVLAEAM from the 1F7A.pdb crystal structure of the D25N mutant of HIV-1 protease bound to that peptide, and the green CPK model displays the wild-type snapshot that sampled the largest flap–Asp distance (i.e., snapshot 11,353 psec, distance = 18.1 Å).
Figure 9.
Figure 9.
The most open snapshot from the mutant’s simulation: The red space-filling model displays snapshot 18,282 psec from the mutant’s simulation, which is the mutant snapshot that displayed the largest value for the distance between I50 and D25. The green space-filling model represents the substrate KARVLAEAM from the 1F7A.pdb crystal structure of the D25N mutant of HIV-1 protease bound to that peptide. The backbone atoms of residues 6–30 and 106–130 were used to superimpose the 1F7A complex onto the snapshot from 18,282 psec, and then the protease molecule from the 1F7A complex was hidden. This mutant snapshot has more than enough space to easily accommodate its natural substrate.
Figure 10.
Figure 10.
Global maxima for flap tip A-to-catalytic Asp 25 distances compared to the crystal structures of the closed and semiopen conformations: The closed conformation of the wild-type crystal structure (1KZK) is shown as the violet ribbon, and the semiopen conformation of the 1HHP crystal structure is displayed as the monomer on the right in white line-ribbon mode. The mutant snapshot that sampled the largest distance from I50 C α to D25 C β (i.e., snapshot 18,282 psec, distance = 25.2 Å) is depicted as the red ribbon, and the green ribbon displays the wild-type snapshot that sampled the largest flap–Asp distance (i.e., snapshot 11,353 ps, distance = 18.1 Å). For the distance values displayed by the crystal structures for this dimension, see the caption for Figure 6 ▶.
Figure 11.
Figure 11.
The most open snapshots from the mutant’s simulation compared to the closed and semiopen crystallographic conformations: The solid ribbon in cyan represents the mutant’s crystal structure of the closed complex (1D4S), while the monomer on the right with a solid orange ribbon shows the semiopen conformation of the 1HHP crystal structure of the apo protease. The ribbons shown in line mode depict the local maxima for the distance between I50 and D25 in the mutant’s simulation. These maxima were the peaks from different flap opening events. The following snapshots are displayed: 18,282 = red (I50–D25 distance was 25.2 Å), 20,210 = orange (24.4 Å), 18,821 = green (23.6 Å), 15,296 = light blue (23.0 Å), 12,066 = purple (22.9 Å), and 17,620 = magenta (22.9 Å). For the maxima from the wild-type simulation along this dimension, see Fig. 16 ▶.
Figure 12.
Figure 12.
Distances between the center of mass of the top of both flap tips to a catalytic Asp: The distances between the center of mass of G51 and G151 to either D25 C β or D125 C β were measured. The black and red curves symbolize the distance between the center of mass of two residues at the tops of the tips of both flaps to the catalytic Asp of monomer B (i.e., distance L) for wild-type and for mutant, respectively. The blue and magenta curves depict the distance from the C.O.M. of the tips of both flaps to the catalytic Asp of monomer A for wild-type and for mutant (i.e., dist. L2), respectively. For comparison, that distance had a value of 19.7 Å in the 1HHP.pdb [semiopen] structure, while its values in the closed crystallographic complexes for distances L and L2 were 15.0 Å and 14.9 Å in 1KZK and 14.6 Å and 14.1 Å in 1D4S. The ribbon diagram displays the location of distance L2; the red stick connects the two Gly residues whose center of mass was utilized, while the magenta stick connects that center of mass to the respective catalytic Asp.
Figure 13.
Figure 13.
Distances between the center of mass of the bottom of both flap tips to a catalytic Asp: The distances between the center of mass of G49 and G149 to either D25 C β or D125 C β were measured. The black and red curves symbolize the distance between the center of mass of two residues at the bottom of the tips of both flaps to the catalytic Asp of monomer A for wild-type and for mutant, respectively. The blue and magenta curves depict the distance from the C.O.M. of the tips of both flaps to the catalytic Asp of monomer B for wild-type and for mutant, respectively. For this dimension, 14.6 Å = semiopen, and the values of distances M and M2 in the closed crystallographic complexes were as follows: 11.0 Å and 11.5 Å in 1KZK (w.t.) and 10.4 Å and 10.5 Å in 1D4S. The ribbon diagram displays the location of distance M2; the red stick connects the two Gly residues whose center of mass was utilized, while the magenta stick connects that center of mass to the respective catalytic Asp.
Figure 14.
Figure 14.
Distances between the ear and the cheek: The histograms on the left depict the distance from the Ear Flap tip (P39 C α) to the Cheek Turn (G16 C α), while the histograms on the right display the distance from the Ear Flap Tip (G40 C α) to the Cheek Sheet (Q61 C α). As in all figures, red = mutant (i.e., 1D4S), and black = wild type (i.e., 1KZK). The values for these distances in the crystal structures were as follows: P39–G16 in 1KZK = 7.9 Å, in 1D4S = 9.0 Å, and in 1HHP = 8.4 Å; G40–Q61 in 1KZK = 9.6 Å, in 1D4S = 9.7 Å, and in 1HHP = 9.4 Å. The ribbon diagram below each graph displays the particular distance value measured as a magenta stick.
Figure 15.
Figure 15.
Qualitative anticorrelation between flap–Asp distances and Ear–Cheek distances: Both lines represent distance trajectories from the wild-type ensemble, but the same trend was observed in the mutant’s trajectories. The black line above displays the trajectory of the flaps-to-Asp distance (C.O.M. of G51 + G151 to D125 C β), while the blue curve below depicts the Ear-to-Cheek distance (G40 C α–Q61 C α). The two trajectories have a pseudomirror symmetry plane between them, which indicates that they are displaying anticorrelated motion.
Figure 16.
Figure 16.
A comparison of the most open snapshots from the wild-type’s simulation to the most closed snapshot supports that anticorrelated relationship: The solid ribbon in cyan represents the wild-type’s snapshot that displayed the second smallest value for the I50–D25 distance (cyan = 19,471 psec, value = 10.7 Å; the absolute minimum was snapshot 17,505, with a value of 10.6 Å), while the monomer on the left with a solid orange ribbon shows the semiopen conformation of the 1HHP crystal structure of the apo protease. The ribbons shown in line mode depict the local maxima for the distance between I50 and D25 from the wild-type’s simulation. These maxima were the peaks from different flap opening events. The following snapshots are displayed: 11,353 = red (I50–D25 distance was 18.1 Å = the global max.), 11,574 = magenta (17.3 Å), 8647 = blue (16.6 Å). For the corresponding maxima from the mutant’s simulation, see Fig. 11 ▶. The snapshot with the smallest distance between its flap and Asp 25 (i.e., the cyan ribbon) has the largest distance between its Ear and Cheek regions.
Figure 17.
Figure 17.
A comparison of the local extrema sampled during the opening event that reached the wild-type’s global maximum supports that anticorrelated relationship: The ribbon diagrams show snapshots of the local extrema involved in the flap opening event that proceeded from an I50–D25 value of 13.4 Å at 11,227 psec (the red ribbon) to a value of 18.1 Å at 11,353 psec (the purple ribbon). The other snapshots are as follows: 11,273 = orange (17.6 Å) and 11,284 = green (14.5 Å). Examine the left side of the figure. Note that the conformation with the largest flap–Asp distance (the purple ribbon) also has the most compressed Ear–Cheek region.

References

    1. Ala, P.J., Huston, E.E., Klabe, R.M., McCabe, D.D., Duke, J.L., Rizzo, C.J., Korant, B.D., DeLoskey, R.J., Lam, P.Y.S., Hodge, C.N., et al. 1997. Molecular basis of HIV-1 protease drug resistance: Structural analysis of mutant proteases complexed with cyclic urea inhibitors. Biochemistry 36 1573–1580. - PubMed
    1. Berendsen, H.J.C., Postma, J.P.M., van Gunsteren, W.F., DiNola, A., and Haak, J.R. 1984. Molecular dynamics with coupling to an external bath. J. Chem.Phys. 81 3684–3690.
    1. Berman, H.M., Westbrook, J., Feng, Z., Gilliland, G., Bhat, T.N., Weissig, H., Shindyalov, I.N., and Bourne, P.E. 2000. The Protein Data Bank. Nucleic Acids Res. 28 235–242. - PMC - PubMed
    1. Case, D.A., Pearlman, D.A., Caldwell, J.W., Cheatham III, T.E., Wang J., Ross, W.S., Simmerling, C., Darden, T., Merz, K.M., Stanton, R.V., et al. 2002. AMBER 7. University of California, San Francisco.
    1. Collins, J.R., Burt, S.K., and Erickson, J.W. 1995. Flap opening in HIV-1 protease simulated by “activated” molecular dynamics. Nat. Struct. Biol. 2 334–338. - PubMed

Publication types

LinkOut - more resources