

Population pharmacokinetics of arbekacin, vancomycin, and panipenem in neonates
- PMID: 15047516
- PMCID: PMC375245
- DOI: 10.1128/AAC.48.4.1159-1167.2004
Population pharmacokinetics of arbekacin, vancomycin, and panipenem in neonates
Abstract
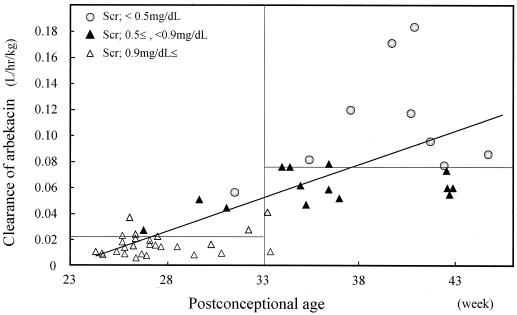
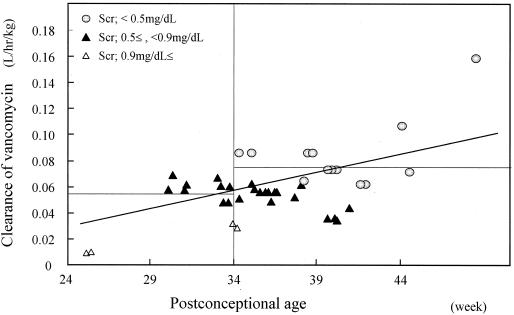
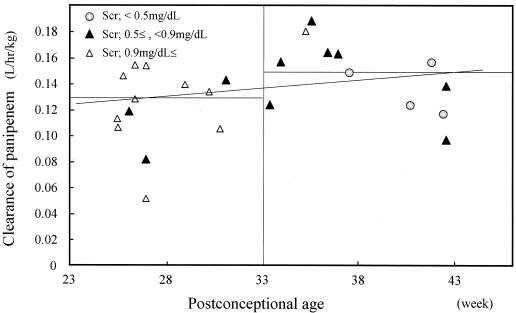
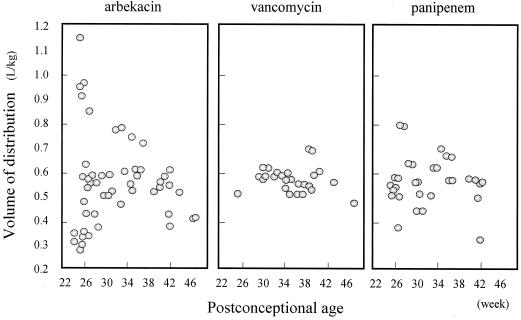
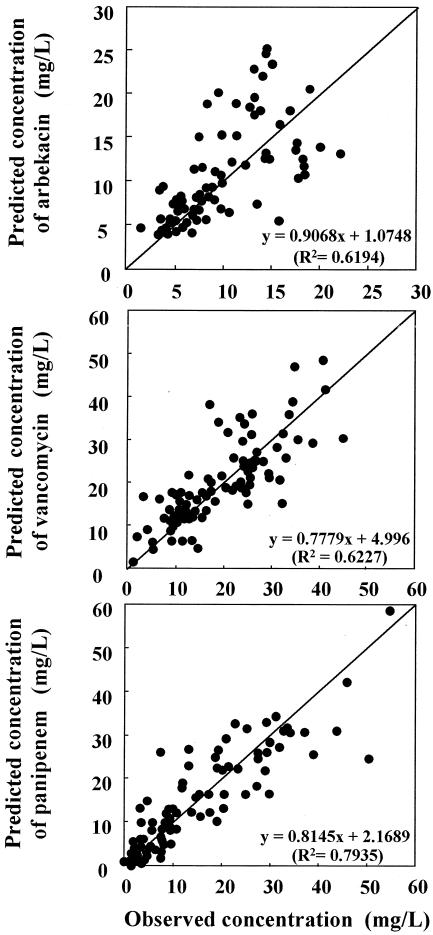
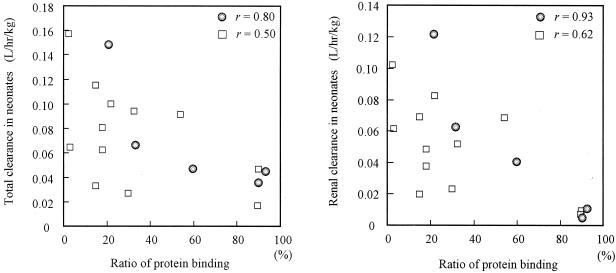
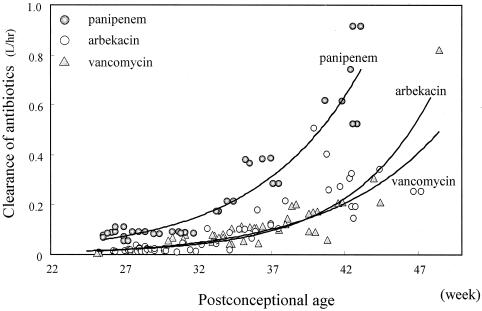
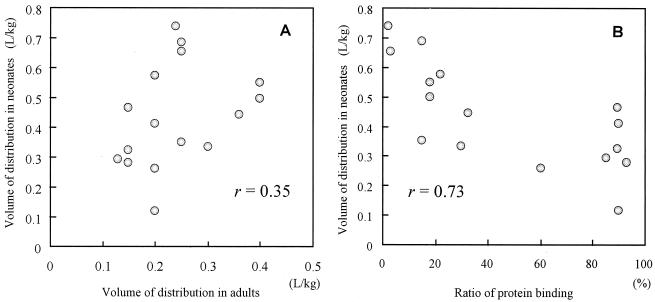
Immature renal function in neonates requires antibiotic dosage adjustment. Population pharmacokinetic studies were performed to determine the optimal dosage regimens for three types of antibiotics: an aminoglycoside, arbekacin; a glycopeptide, vancomycin; and a carbapenem, panipenem. Eighty-three neonates received arbekacin (n = 41), vancomycin (n = 19), or panipenem (n = 23). The postconceptional ages (PCAs) were 24.1 to 48.4 weeks, and the body weights (BWs) ranged from 458 to 5,200 g. A one-compartment open model with first-order elimination was applied and evaluated with a nonlinear mixed-effect model for population pharmacokinetic analysis. In the fitting process, the fixed effects significantly related to clearance (CL) were PCA, postnatal age, gestational age, BW, and serum creatinine level; and the fixed effect significantly related to the volume of distribution (V) was BW. The final formulas for the population pharmacokinetic parameters are as follows: CL(arbekacin) = 0.0238 x BW/serum creatinine level for PCAs of <33 weeks and CL(arbekacin) = 0.0367 x BW/serum creatinine level for PCAs of > or = 33 weeks, V(arbekacin) = 0.54 liters/kg, CL(vancomycin) = 0.0250 x BW/serum creatinine level for PCAs of <34 weeks and CL(vancomycin) = 0.0323 x BW/serum creatinine level for PCAs of > or = 34 weeks, V(vancomycin) = 0.66 liters/kg, CL(panipenem) = 0.0832 for PCAs of <33 weeks and CL(panipenem) = 0.179 x BW for PCAs of > or = 33 weeks, and V(panipenem) = 0.53 liters/kg. When the CL of each drug was evaluated by the nonlinear mixed-effect model, we found that the mean CL for subjects with PCAs of <33 to 34 weeks was significantly smaller than those with PCAs of > or = 33 to 34 weeks, and CL showed an exponential increase with PCA. Many antibiotics are excreted by glomerular filtration, and maturation of glomerular filtration is the most important factor for estimation of antibiotic clearance. Clinicians should consider PCA, serum creatinine level, BW, and chemical features when determining the initial antibiotic dosing regimen for neonates.
Figures
References
-
- Albrecht, L. M., M. J. Rybak, L. H. Warbasse, and D. J. Edwards. 1991. Vancomycin protein binding in patients with infections caused by Staphylococcus aureus. DICP = Ann. Pharmacother. 25:713-715. - PubMed
-
- Arant, B. S., Jr. 1978. Developmental patterns of renal functional maturation compared in the human neonate. J. Pediatr. 92:705-712. - PubMed
-
- Asbury, W. H., E. H. Darsey, W. B. Rose, J. E. Murphy, D. E. Buffington, and C. C. Capers. 1993. Vancomycin pharmacokinetics in neonates and infants: a retrospective evaluation. Ann. Pharmacother. 27:490-496. - PubMed
-
- Beal, S. L., A. Beckman, and L. B. Sheiner. 1992. NONMEM users guides, version IV. NONMEM Projects Group, University of California, San Francisco.
Publication types
MeSH terms
Substances
LinkOut - more resources
Full Text Sources
Medical
