. 2004 May 15;557(Pt 1):229-45.
doi: 10.1113/jphysiol.2003.058065. Epub 2004 Mar 26.

Chromatic and spatial properties of parvocellular cells in the lateral geniculate nucleus of the marmoset (Callithrix jacchus)

Affiliations

Chromatic and spatial properties of parvocellular cells in the lateral geniculate nucleus of the marmoset (Callithrix jacchus)

Esther M Blessing et al. J Physiol. .

Abstract

The parvocellular (PC) division of the afferent visual pathway is considered to carry neuronal signals which underlie the red-green dimension of colour vision as well as high-resolution spatial vision. In order to understand the origin of these signals, and the way in which they are combined, the responses of PC cells in dichromatic ('red-green colour-blind') and trichromatic marmosets were compared. Visual stimuli included coloured and achromatic gratings, and spatially uniform red and green lights presented at varying temporal phases and frequencies.The sensitivity of PC cells to red-green chromatic modulation was found to depend primarily on the spectral separation between the medium- and long-wavelength-sensitive cone pigments (20 or 7 nm) in the two trichromatic marmoset phenotypes studied. The temporal frequency dependence of chromatic sensitivity was consistent with centre-surround interactions. Some evidence for chromatic selectivity was seen in peripheral PC cells. The receptive field dimensions of parvocellular cells were similar in dichromatic and trichromatic animals, but the achromatic contrast sensitivity of cells was slightly higher (by about 30%) in dichromats than in trichromats. These data support the hypothesis that the primary role of the PC is to transmit high-acuity spatial signals, with red-green opponent signals appearing as an additional response dimension in trichromatic animals.


Figures

Figure 1
Figure 1. Identification of cone opsin-encoding genes in marmosets
Each panel shows agarose gel electrophoresis of BglII, HpyCH4III, or PvuI restriction digestion products. Lane 1, molecular weight markers. Lanes 2∓6, DNA amplification products from five animals: MY76, MY83, MY82, MY84 and MY85. Five of the possible genotypes predicted by the single locus model are present. The predicted phenotype is indicated by the nominal peak wavelength values above each lane.
Figure 2
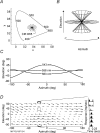
Figure 2. Analysis of spectral inputs to marmoset PC cells
The chromaticity coordinates and modulation direction of eight gratings in the isoluminant plane are indicated in A. Each modulation line bisects the central white point (CIE D65). Combined luminance and chromatic modulation was achieved by ‘tilting’ the modulation direction out of the isoluminant plane, as indicated in B. Each stimulus point is defined by its azimuth (relative to the CIE x-axis) and elevation (relative to the isoluminant plane). The isolept or silent substitution lines for cone fundamentals with maximum sensitivities at 543, 556 or 563 nm are shown in C. Responses of one magnocellular cell in a marmoset with the P543 genotype are shown in D. Each arrow shows the phase and amplitude of the fundamental Fourier component (F1) of the cell response to grating modulation at the stimulus position defined by the tail of the arrow. Peri-stimulus time histograms for different elevation values at the indicated azimuth are shown to the right of the vector map (from top): 90 deg, 45 deg, 22.5 deg, 0 deg, −22.5 deg, −45 deg, −90 deg. The trajectory of the response minima can be seen to match the isolept for the 543 cone mechanism.
Figure 3
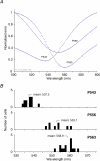
Figure 3. Correlation of phenotype with genotype in marmosets
A shows residual error from predictions of cell response amplitude as a function of peak sensitivity of cone fundamentals. Data from one magnocellular pathway cell for each dichromatic genotype are shown. The best-fitting wavelengths for these cells are: P543, 538 nm; P556, 554 nm; P563, 561 nm. Histograms in B show best-fitting wavelength for MC and PC cells recorded in animals of each tested genotype. Values for dichromatic cells are clustered close to the predicted spectral peak.
Figure 4
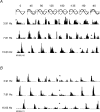
Figure 4. Responses of PC cells in two trichromatic phenotypes to one cycle of modulation at different relative diode phases.
About 8 s of activity are averaged in each histogram. A shows responses of one cell in the Δ20 nm phenotype; responses in the Δ7 nm phenotype are shown in B. The temporal waveform of the stimulus is depicted above the histograms. Continuous line, red LED; dashed line, green LED. Asterisks mark the histograms with minimum amplitude.
Figure 5
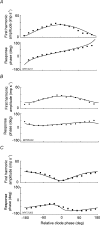
Figure 5. Comparison of PC cell response amplitude and phase as a function of relative diode phase in different colour vision phenotypes
One cell in the 556 phenotype is shown in A. Cells in the Δ7 nm and Δ20 nm phenotypes are shown in B and C, respectively. Continuous lines show predictions of the model described in the text. Note the minimum response amplitude for in-phase diode modulation in the Δ20 nm phenotype.
Figure 6
Figure 6. Estimation of centre—surround phase delay
Mean and s.e.m. of the centre—surround phase delay parameter θΔ for 5 cells in the Δ20 nm trichromat phenotype are shown in A, and for 5 cells in the Δ7 nm trichromat phenotype are shown in B. Equivalent response latency was estimated from the slope of the least-square regression lines (continuous lines).
Figure 7
Figure 7. Contrast sensitivity
The top panels show example contrast—response functions for PC cells in three phenotypes. A, 556 nm dichromat; B, Δ7 nm trichromat; C, Δ20 nm trichromat. •, luminance modulation; ○, red—green chromatic modulation. The lower panels show response gain for the two stimulus conditions for PC cells in these phenotypes. D, 556 nm dichromat; E, Δ7 nm trichromat; F, Δ20 nm trichromat.
Figure 8
Figure 8. Spatial and chromatic properties of PC cells
Upper panels show spatial frequency tuning curves for achromatic sine gratings. Lower panels show contrast—response functions as in Fig. 9. Responses of a PC cell in the Δ20 nm trichromatic phenotype are shown in A and C. Responses in a 563 nm dichromat are shown in B and D. Lines in A and B show difference-of-Gaussians fit and components. Lines in C and D show linear fits as in Fig. 9. • in C and D, luminance modulation; ○ in C and D, red—green chromatic modulation.
Figure 9
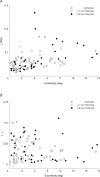
Figure 9. Comparison of receptive field dimensions in different colour vision phenotypes
Stimuli were achromatic sine gratings. Each point in A shows centre radius (rc) from the difference-of-Gaussians model described in the text. The ratio of centre radius to surround radius (rs) is shown in B.
Figure 10
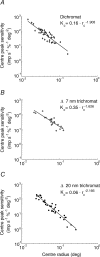
Figure 10. Achromatic contrast sensitivity and centre radius in different colour vision phenotypes
Stimuli were achromatic sine gratings. Continuous lines show linear regression on log-transformed data for the centre components. Abbreviations: Kc, centre sensitivity; rc, centre radius.

References

    1. Baylor DA, Nunn BJ, Schnapf JL. Spectral sensitivity of cones of the monkey Macaca fascicularis. J Physiol. 1987;390:145–160. - PMC - PubMed
    1. Benardete EA, Kaplan E. The receptive field of the primate P retinal ganglion cell, I: Linear dynamics. Visual Neurosci. 1997;14:169–186. - PubMed
    1. Brainard DH. Cone contrast and opponent modulation color spaces. In: Kaiser PK, Boynton GM, editors. Human Color Vision. Washington, DC: Optical Society of America; 1996. pp. 563–577.
    1. Cavonius CR, Estévez O. Sensitivity of human colour mechanisms to gratings and flicker. J Opt Soc Am A. 1975;65:966–968. - PubMed
    1. Chan TL, Martin PR, Clunas N, Grünert U. Bipolar cell diversity in the primate retina: Morphologic and immunocytochemical analysis of a New World monkey, the marmoset Callithrix jacchus. J Comp Neurol. 2001;437:219–239. - PubMed

Publication types

MeSH terms

LinkOut - more resources