. 2004 Jun 1;557(Pt 2):689-700.
doi: 10.1113/jphysiol.2003.059808. Epub 2004 Mar 26.

Exploring the connectivity between the cerebellum and motor cortex in humans

Affiliations

Exploring the connectivity between the cerebellum and motor cortex in humans

Zafiris J Daskalakis et al. J Physiol. .

Abstract

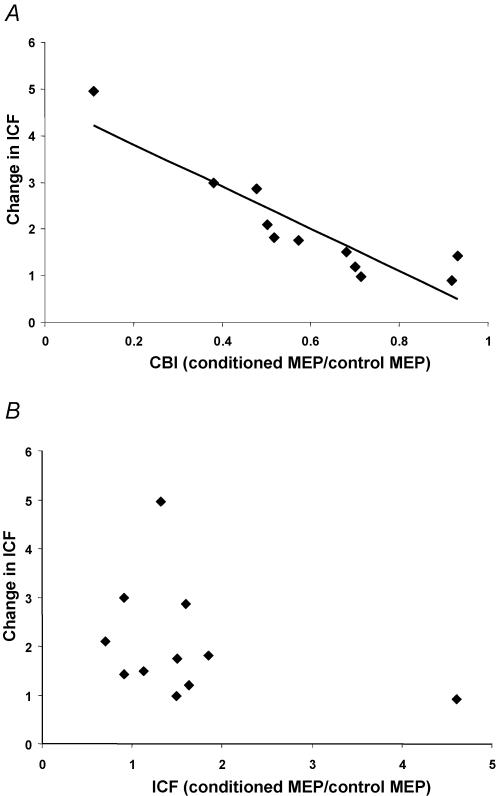
Animal studies have shown that cerebellar projections influence both excitatory and inhibitory neurones in the motor cortex but this connectivity has yet to be demonstrated in human subjects. In human subjects, magnetic or electrical stimulation of the cerebellum 5-7 ms before transcranial magnetic stimulation (TMS) of the motor cortex decreases the TMS-induced motor-evoked potential (MEP), indicating a cerebellar inhibition of the motor cortex (CBI). TMS also reveals inhibitory and excitatory circuits of the motor cortex, including a short-interval intracortical inhibition (SICI), long-interval intracortical inhibition (LICI) and intracortical facilitation (ICF). This study used magnetic cerebellar stimulation to investigate connections between the cerebellum and these cortical circuits. Three experiments were performed on 11 subjects. The first experiment showed that with increasing test stimulus intensities, LICI, CBI and ICF decreased, while SICI increased. The second experiment showed that the presence of CBI reduced SICI and increased ICF. The third experiment showed that the interaction between CBI and LICI reduced CBI. Collectively, these findings suggest that cerebellar stimulation results in changes to both inhibitory and excitatory neurones in the human motor cortex.


Figures

Figure 1
Figure 1. Effects of increasing TS intensity on cortical inhibition and facilitation
Data are from 11 subjects. Each measure is expressed as a ratio (mean ± s.e.m.) of the conditioned MEP amplitude to the unconditioned MEP amplitude. Values below 1 indicate inhibition and those greater than 1 indicate facilitation. With increasing TS intensity SICI increased, whereas LICI, CBI and ICF decreased.
Figure 2
Figure 2. Effects of CBI on SICI in a single subject
These traces represent the average of 10 trials from a single subject. In all traces the TS intensity was adjusted to produce 0.5 mV MEPs when preceded by a CCS5 (i.e. TS 0.5 mVCCS5). A, response to TS 0.5 mVCCS5 alone (condition 2E). B, SICI alone. The conditioning stimulus (CS2) inhibited the test MEP (condition 2F) compared to A. C, CBI alone. The cerebellar conditioning stimulus (CCS5) also inhibited the test response (condition 2H) compared to A. D, combined CBI and SICI. When the CCS5 preceded the CS2 (condition 2I), CS2 led to facilitation rather than inhibition of the test MEP compared to C.
Figure 3
Figure 3. Effects of CBI on SICI and ICF
Data are from 11 subjects. Both inhibition and facilitation are expressed as a ratio (mean ± s.e.m.) of the conditioned MEP amplitude to the unconditioned MEP amplitude. Values greater than 1 represent facilitation and those less than 1 represent inhibition. Points above A represent SICI and ICF using a TS that evokes a 0.5 mV MEP (i.e. TS 0.5 mV; conditions 2B/2A and 2C/2A) and points above B represent SICI and ICF with a TS that evokes a 0.5 mV MEP if preceded by a CCS5 stimulus (i.e. TS 0.5 mVCCS5; conditions 2F/2E and 2G/2E). Points above C demonstrate the triple stimulus approach, in which a CS2 or CS10 is preceded by CCS5 (conditions 2I/2H and 2J/2H). Here the test stimulus was TS 0.5 mVCCS5 (condition 2H). There was significantly less SICI and more ICF in the presence of CBI (C) compared to SICI and ICF in the absence of CBI (A and B).
Figure 4
Figure 4. Effects of the strengths of CBI and SICI on CBI—SICI interaction
Data are from 11 subjects and each point represents 1 subject. A, the relationship between CBI and the change in SICI in the presence of CBI. CBI is expressed as a ratio of the conditioned MEP amplitude to the unconditioned MEP amplitude (2H/2E). The y-axis represents a ratio of SICI in the presence of CBI (2I/2H) to SICI alone (2F/2E). Change in SICI was significantly correlated with the strength of CBI. When the outlier with strong CBI was removed, the correlation remained significant (r = 0.74, P = 0.02). B, the relationship between SICI and the change in SICI in the presence of CBI. SICI is expressed as a ratio of the conditioned MEP amplitude to the unconditioned MEP amplitude (2F/2E). The y-axis represents a ratio of the SICI in the presence of CBI (2I/2H) to SICI alone (2F/2E). There was no correlation.
Figure 5
Figure 5. Effects of the strengths of CBI and ICF on CBI—ICF interaction
Data are from 11 subjects and each point represents 1 subject. A, the relationship between CBI and the change in ICF in the presence of CBI. CBI is expressed as a ratio of the conditioned MEP amplitude to the unconditioned MEP amplitude (2H/2E). The y-axis represents a ratio of ICF in the presence of CBI (2J/2H) to ICF alone (2G/2E). Change in ICF was significantly correlated with the strength of CBI. B, the relationship between ICF and the change in ICF in the presence of CBI. ICF is expressed as a ratio of the conditioned MEP amplitude to the unconditioned MEP amplitude (2G/2E). The y-axis represents a ratio of the ICF in the presence of CBI (2J/2H) to ICF alone (2G/2E). There was no correlation.
Figure 6
Figure 6. Effects of LICI on CBI in a single subject
Traces represent the averaged waveform for a single subject. A, response to TS 0.5 mV alone (condition 3A). B, CBI alone. A cerebellar conditioning stimulus (CCS5) inhibited the test response (condition 3B) compared to A. The TS was the same as in A. C, LICI alone. A conditioning stimulus (CS100) using a TS that evokes a 0.5 mV MEP if preceded by a CS100 stimulus (i.e. TS 0.5 mVCS100; condition 3F). The test MEP amplitude here is matched with that in A. D, combined LICI and CBI (condition 3G). Using both CS100 and CCS5 conditioning stimuli caused MEP facilitation compared to that shown in B and C.
Figure 7
Figure 7. Effects of LICI on CBI
Data are from 11 subjects. Inhibition is expressed as a ratio of the conditioned MEP amplitude to the unconditioned MEP amplitude (mean ± s.e.m.). Values less than 1 represent inhibition. A, CBI using a TS that evokes a 0.5 mV MEP (i.e. TS 0.5 mV; condition 3B/3A). B, CBI using a TS that evokes a 0.5 mV MEP if preceded by a CS100 stimulus (i.e. TS 0.5 mVCS100; condition 3E/3D). C, the triple stimulus approach, in which a CCS5 is preceded by a CS100 conditioning stimulus (condition 3G/3F). Here the test stimulus was TS 0.5 mVCS100 (3F). CBI was less for the TS 0.5 mVCS100 (B) than the lower TS 0.5 mV (A). In the presence of LICI, CBI was significantly reduced when matched for test MEP amplitude (A versus C) and when matched for test stimulus intensity (B versus C).
Figure 8
Figure 8. A possible model that may explain our experimental findings
Each diamond schematically represents a population of neurons mediating either inhibitory or facilitatory processes (i.e. SICI, LICI and ICF) or an anatomic location (i.e. DCN, VLN, IOP and PC). The diamond labelled ‘I’ represents cells leading to descending I-waves and ‘O’ represents corticospinal output neurones. LICI is shown to inhibit SICI based on the result of a previous study (Sanger et al. 2001). Jagged arrows represent the presumed site of TMS stimulation. The question marks indicate pathways that may explain some of our experimental findings, but whether they are involved remain speculative. Thick lines represent connections confirmed by these experimental findings. Our finding of reduced SICI in the presence of CBI can be explained by activation of the cerebellar Purkinje cell (PC) leading to suppression of excitatory output from deep cerebellar nuclei (DCN). This results in suppression of excitatory output from the ventrolateral nucleus of the thalamus (VL), leading to decreased excitatory drive to output neurones (causing decreased MEP amplitude) as well as inhibitory (SICI) interneurones (thick line). TMS-induced activation of corticospinal output neurones by the conditioning pulse for LICI may activate thalamic inhibitory neurones (TIN) or reticular nuclei neurones (RNN) that, in turn, inhibit thalamocortical neurones; this may account for the finding of decreased CBI in the presence of LICI. Alternatively, activation of the mossy fibres that come from the pontine nuclei (PN) via the pontocerebellar pathway may inhibit Purkinje cells through activation of inhibitory Golgi cells (GC) and basket cells (BC). Another possibility is that cortical projection activates the inferior olive (IO) and the collaterals of the climbing fibres also innervate the inhibitory GC and BC that may also lead to decreased PC output. It is important to note that while these pathways exist, their involvement in these experimental paradigms remains speculative.

References

    1. Allen GI, Tsukahara N. Cerebrocerebellar communication systems. Physiol Rev. 1974;54:957–1006. - PubMed
    1. Ando N, Izawa Y, Shinoda Y. Relative contributions of thalamic reticular nucleus neurons and intrinsic interneurons to inhibition of thalamic neurons projecting to the motor cortex. J Neurophysiol. 1995;73:2470–2485. - PubMed
    1. Andreasen NC, Nopoulos P, O'Leary DS, Miller DD, Wassink T, Flaum M. Defining the phenotype of schizophrenia: cognitive dysmetria and its neural mechanisms. Biol Psychiatry. 1999;46:908–920. - PubMed
    1. Baron RM, Kenny DA. The moderator-mediator variable distinction in social psychological research: conceptual, strategic, and statistical considerations. J Pers Soc Psychol. 1986;51:1173–1182. - PubMed
    1. Chen R, Lozano AM, Ashby P. Mechanism of the silent period following transcranial magnetic stimulation. Evidence from epidural recordings. Exp Brain Res. 1999;128:539–542. - PubMed

LinkOut - more resources