. 2004 Apr 5;199(7):947-57.
doi: 10.1084/jem.20031389. Epub 2004 Mar 29.

Prevention of autoimmunity by targeting a distinct, noninvariant CD1d-reactive T cell population reactive to sulfatide

Affiliations

Prevention of autoimmunity by targeting a distinct, noninvariant CD1d-reactive T cell population reactive to sulfatide

Alex Jahng et al. J Exp Med. .

Abstract

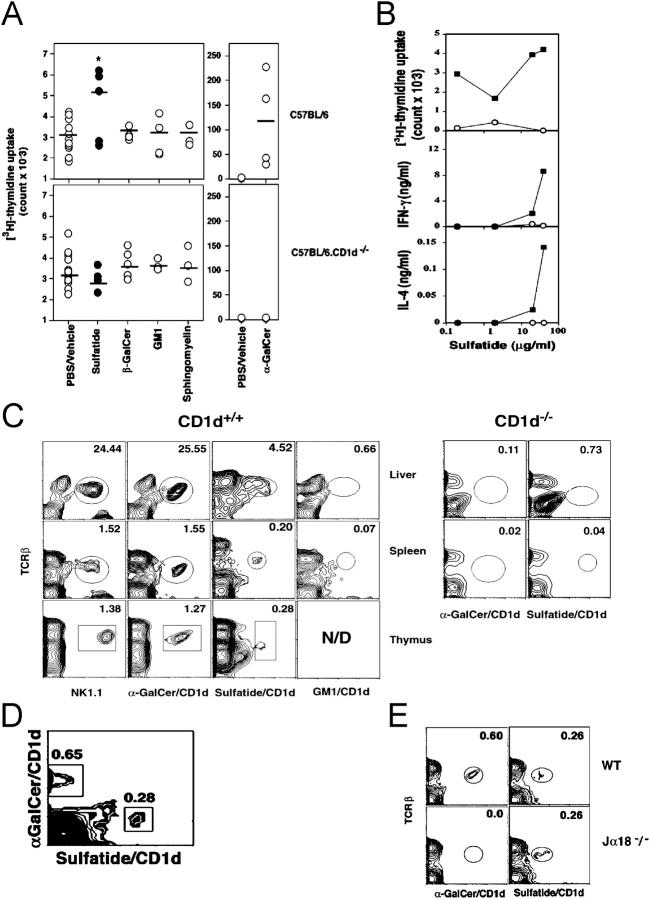
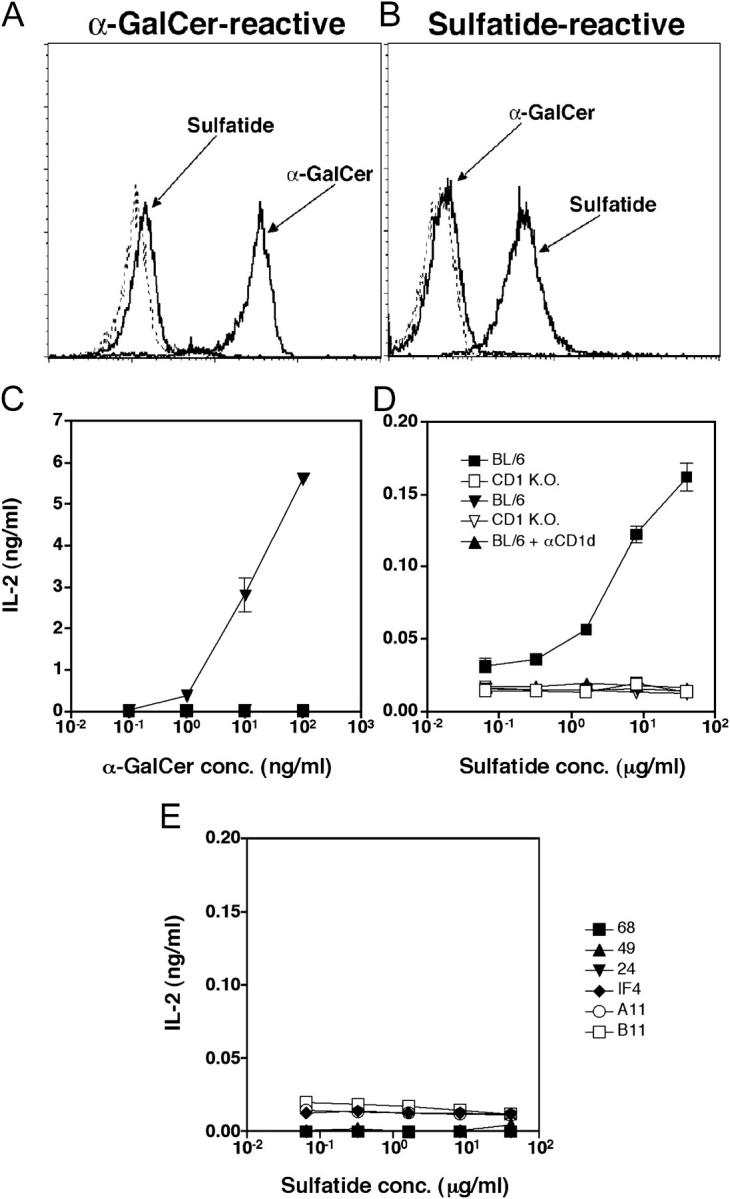
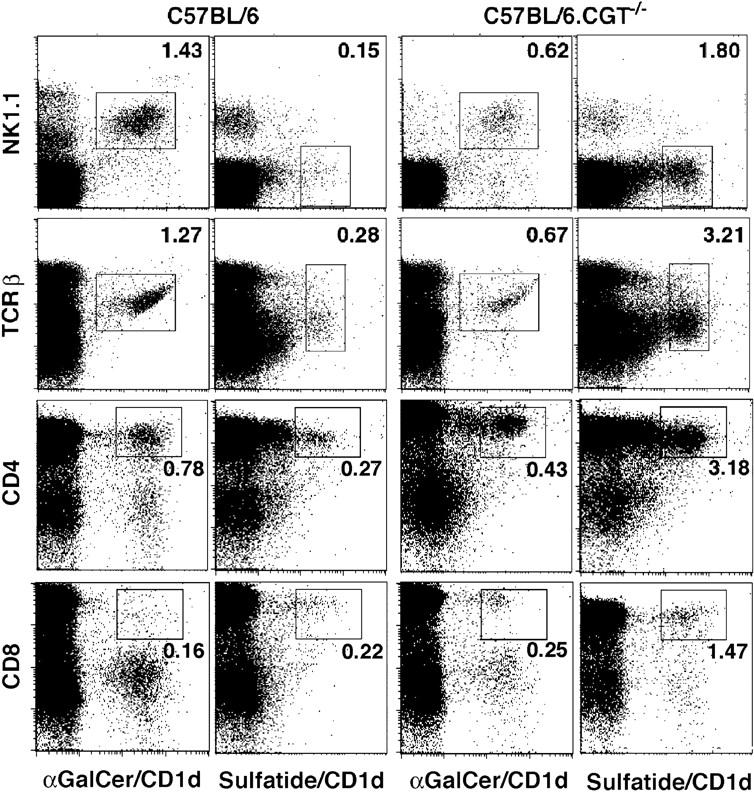
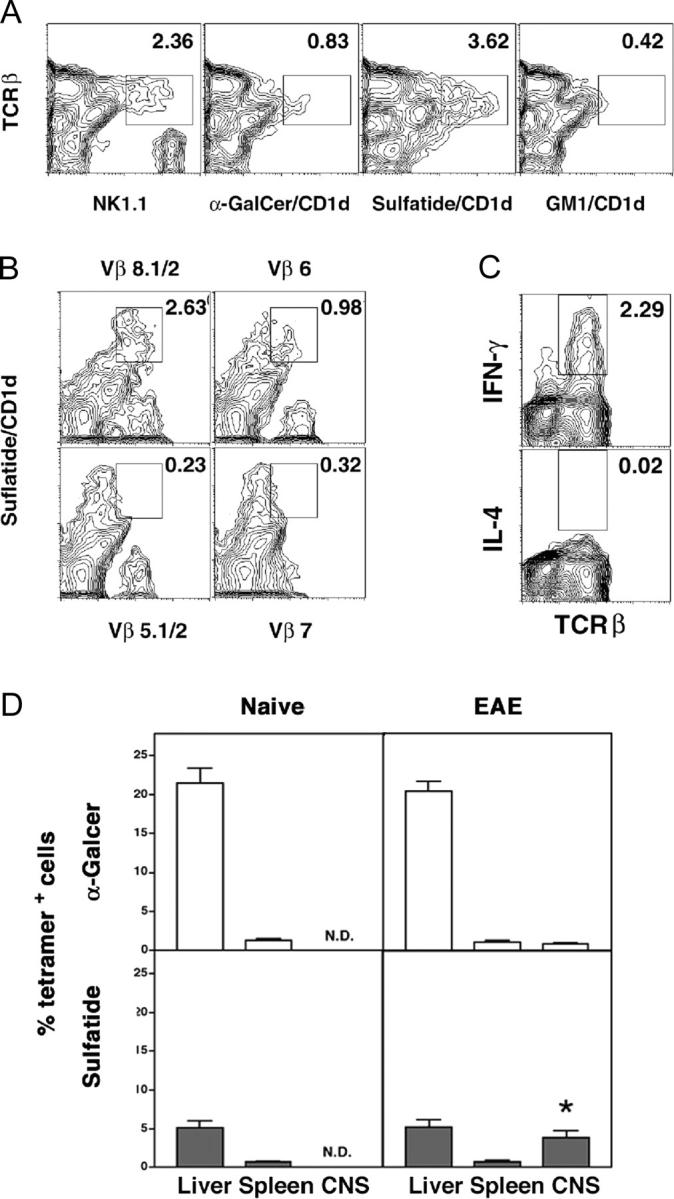
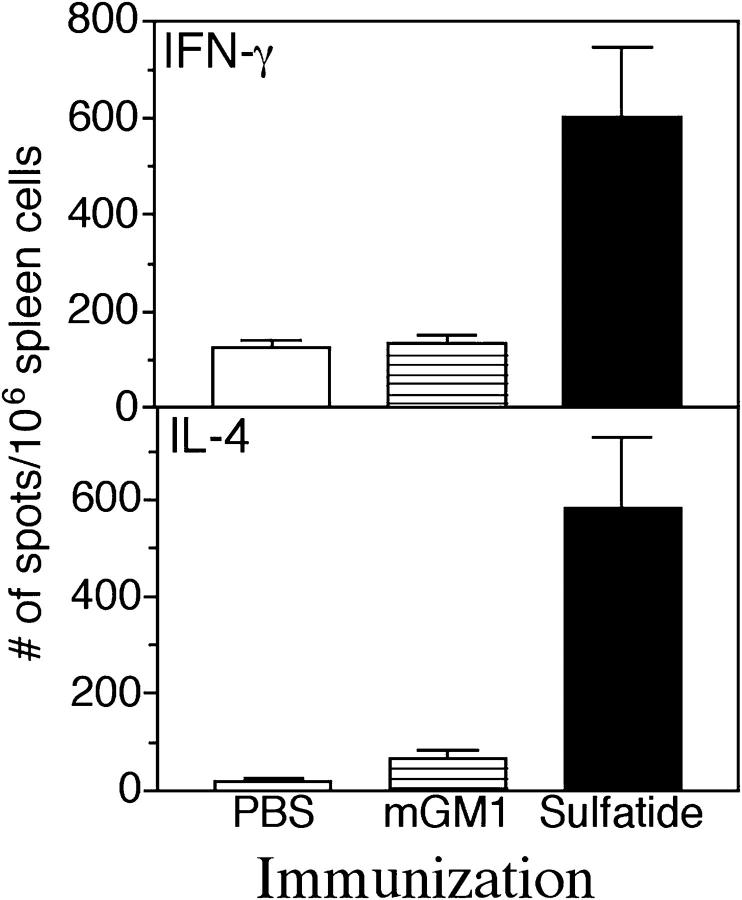
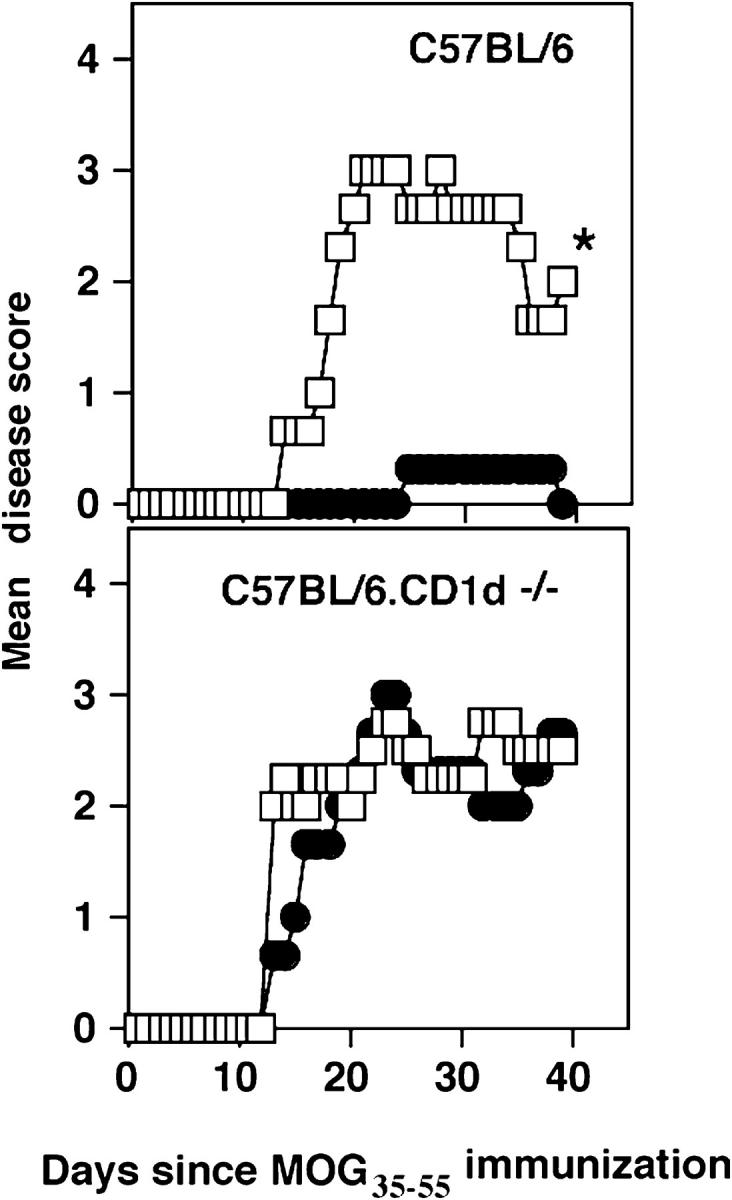
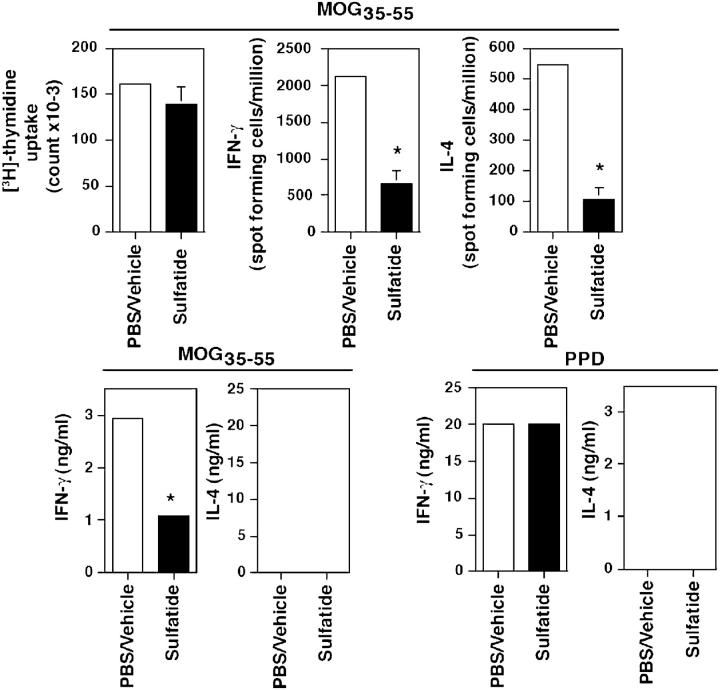
Class I and class II MHC-restricted T cells specific for proteins present in myelin have been shown to be involved in autoimmunity in the central nervous system (CNS). It is not yet known whether CD1d-restricted T cells reactive to myelin-derived lipids are present in the CNS and might be targeted to influence the course of autoimmune demyelination. Using specific glycolipid-CD1d tetramers and cloned T cells we have characterized a T cell population reactive to a myelin-derived glycolipid, sulfatide, presented by CD1d. This population is distinct from the invariant Valpha14+ NK T cells, and a panel of Valpha3/Valpha8+ CD1d-restricted NK T cell hybridomas is unable to recognize sulfatide in the presence of CD1d+ antigen-presenting cells. Interestingly, during experimental autoimmune encephalomyelitis a model for human multiple sclerosis, sulfatide-reactive T cells but not invariant NK T cells are increased severalfold in CNS tissue. Moreover, treatment of mice with sulfatide prevents antigen-induced experimental autoimmune encephalomyelitis in wild-type but not in CD1d-deficient mice. Disease prevention correlates with the ability of sulfatide to suppress both interferon-gamma and interleukin-4 production by pathogenic myelin oligodendrocyte glycoprotein-reactive T cells. Since recognition of sulfatide by CD1d-restricted T cells has now been shown both in mice and humans, study of murine myelin lipid-reactive T cells may form a basis for the development of intervention strategies in human autoimmune demyelinating diseases.


Figures

Figure 1.
Figure 1.
A distinct CD1d-restricted sulfatide-reactive T cell population in naive mice. (A) Proliferative response of splenocytes from naive BL/6 or BL/6.CD1d−/− mice in response to an in vitro stimulation with indicated self-lipids (10 μg/ml) or α-GalCer (10 ng/ml) suspended in PBS/vehicle. Each symbol represents response of an individual animal in each group (n = 4–11), with the mean proliferative response indicated by a horizontal bar. *P = 0.004. (B) In vitro cytokine and proliferative response of splenocytes from naive BL/6 (▪) or BL/6.CD1d−/− (○) mice to a titrated dose of sulfatide. One of three representative experiments is shown. (C) FACS® analysis of lymphocytes from the liver, spleen, and thymus from BL/6 (CD1d+/+) or BL/6.CD1d−/− (CD1d−/−) mice after staining with fluoresceinated tetramers or anti-NK1.1 mAbs in conjunction with the anti-TCRβ chain antibody. One of three representative experiments is shown. (D) Flow cytometric profile of splenocytes from BL/6 mice stained simultaneously with the CyChrome-labeled α-GalCer/CD1d tetramers and with the PE-labeled sulfatide/CD1d tetramers. (E) Flow cytometric profile of splenocytes from BL/6 and BL/6.Jα18−/− mice stained with α-GalCer/CD1d tetramers or sulfatide/CD1d tetramers.
Figure 2.
Figure 2.
Sulfatide-reactive T cell hyridomas stain with sulfatide/CD1d tetramer and secrete IL-2 in response to sulfatide in a CD1d-dependent manner. A representative T cell hybridoma reactive to sulfatide (Hy19.3) (B and D) and a α-GalCer–reactive hybridoma (Hy1.2) (A and C) were stained with sulfatide/CD1d or α-GalCer/CD1d tetramers and analyzed by FACS®. Unloaded tetramer or GM1-filled tetramer staining is shown by dotted lines. For IL-2 secretion assay, hybridomas (50,000 cells/well) were incubated with irradiated (3000R) splenocytes (400,000 cells/well) from wild-type C57BL/6 (BL/6) or CD1d−/− BL/6 (CD1KO) mice in the absence or presence of graded concentrations of α-GalCer or sulfatide, as shown. For blocking of CD1d-dependent presentation, 10 μg/ml of anti-CD1d mAb (1B1 [47]) or an isotype-matched mAb (IgG2b; BD Biosciences) was added during the incubation period. IL-2 secretion levels by Hy19.3 in response to plate-bound anti-CD3 were 1/8–1/10 that of Hy1.2. Concentration of IL-2 in the supernatants is shown. (E) The CD1d-restricted Vα3+ (A11, 24, IF4), Vα8+ (B11, 49), and Vα4+ (68) T cell hybridomas were incubated with irradiated CD1d+ splenocytes in the presence of graded concentrations of sulfatide, as above. Concentration of IL-2 in the supernatants is shown. All of the hybridomas responded well to plate-bound anti-CD3.
Figure 3.
Figure 3.
Sulfatide/CD1d tetramer+ cells are increased severalfold in mice lacking the CGT. Thymocytes pooled from three age-matched, naive BL/6 or BL/6.CGT−/− mice were stained with α-GalCer/CD1d or sulfatide/CD1d tetramers in conjunction with anti-NK1.1, anti-TCRβ, anti-CD4, or anti-CD8 mAb and analyzed by FACS®. The CD4 and CD8 staining profiles of thymocytes were similar in both sets of mice. This is representative of two independent experiments.
Figure 4.
Figure 4.
Sulfatide-reactive T cells infiltrate the CNS during the course of EAE. (A) Mononuclear cells from the CNS of diseased BL/6 mice (n = 7) were pooled and stained with the indicated lipid/CD1d tetramers and analyzed by FACS®. A representative of two experiments is shown. (B) To analyze the TCR Vβ gene usage, sulfatide/CD1d tetramer+ cells were stained with various anti-Vβ mAbs. A typical positive and negative staining profile is shown. (C) Ex vivo intracytoplasmic staining of the CNS-infiltrating cells for IFN-γ and IL-4. (D) The percentages of α-GalCer– or sulfatide-reactive T cells in spleen, liver, and the CNS of naive animals or mice with EAE were determined by FACS® analysis. The plot represents the averaged data of three independent experiments (a total of 19 mice in each group). *P < 0.0001.
Figure 5.
Figure 5.
Increased frequency of cytokine-secreting, sulfatide-reactive lymphocytes after immunization with sulfatide. Groups of mice (two in each) were immunized in complete Freund's adjuvant with 20 μg of sulfatide or with 20 μg of mono-GM1 or with PBS/vehicle alone. 10 d later, splenocytes were isolated, recalled in vitro with sulfatide, and subjected to ELISPOT analysis as described in Materials and Methods. The average number of spots/106 spleen cells for both IFN-γ and IL-4 in each group is shown.
Figure 6.
Figure 6.
Immunization of mice with sulfatide protects mice from EAE. In a representative experiment, groups of female BL/6 or BL6.CD1−/− mice were immunized i.p. with 20 μg of sulfatide (•) (n = 4) or with PBS/vehicle alone (□) (n = 4) at the time of disease induction with MOG35–55/CFA/PT. The mean clinical disease course of mice in each group is shown. The summary of all independent experiments is provided in Table I. *P < 0.0001.
Figure 7.
Figure 7.
Inhibition of cytokine secretion by MOG-reactive T cells after coinjection with sulfatide. Groups of female BL/6 mice were coinjected i.p. with either 20 μg of sulfatide in PBS/vehicle or PBS/vehicle alone at the time of s.c. challenge with 100 μg MOG35–55 in CFA. 10 d later, LN cells were cultured with graded concentrations of MOG35–55 or protein-purified derivative of Mycobacterium (PPD) for the measurement of proliferation and cytokine secretion by ELISA and ELISPOT analysis. Averaged responses within the group are plotted. A representative of three independent experiments is shown. *P-value < 0.004.

References

    1. Porcelli, S., C.T. Morita, and M.B. Brenner. 1992. CD1b restricts the response of human CD4-8− T lymphocytes to a microbial antigen. Nature. 360:593–597. - PubMed
    1. Sieling, P.A., D. Chatterjee, S.A. Porcelli, T.I. Prigozy, R.J. Mazzaccaro, T. Soriano, B.R. Bloom, M.B. Brenner, M. Kronenberg, P.J. Brennan, et al. 1995. CD1-restricted T cell recognition of microbial lipoglycan antigens. Science. 269:227–230. - PubMed
    1. Bendelac, A., M.N. Rivera, S.H. Park, and J.H. Roark. 1997. Mouse CD1-specific NK1 T cells: development, specificity, and function. Annu. Rev. Immunol. 15:535–562. - PubMed
    1. Porcelli, S.A., B.W. Segelke, M. Sugita, I.A. Wilson, and M.B. Brenner. 1998. The CD1 family of lipid antigen-presenting molecules. Immunol. Today. 19:362–368. - PubMed
    1. Moody, D.B., and S.A. Porcelli. 2003. Intracellular pathways of CD1 antigen presentation. Nat. Rev. Immunol. 3:11–22. - PubMed

Publication types

MeSH terms