. 2004 Apr 6;101(14):5140-5.
doi: 10.1073/pnas.0306141101. Epub 2004 Mar 29.

Physiological changes in extracellular calcium concentration directly control osteoblast function in the absence of calciotropic hormones

Affiliations

Physiological changes in extracellular calcium concentration directly control osteoblast function in the absence of calciotropic hormones

Melita M Dvorak et al. Proc Natl Acad Sci U S A. .

Abstract

We investigated the direct effects of changes in free ionized extracellular calcium concentrations ([Ca2+]o) on osteoblast function and the involvement of the calcium-sensing receptor (CaR) in mediating these responses. CaR mRNA and protein were detected in osteoblast models, freshly isolated fetal rat calvarial cells and murine clonal osteoblastic 2T3 cells, and in freshly frozen, undecalcified preparations of human mandible and rat femur. In fetal rat calvarial cells, elevating [Ca2+]o and treatment with gadolinium, a nonpermeant CaR agonist, resulted in phosphorylation of the extracellular signal-regulated kinases 1 and 2, Akt, and glycogensynthase kinase 3beta, consistent with signals of cell survival and proliferation. In agreement, cell number was increased under these conditions. Expression of the osteoblast differentiation markers core binding factor alpha1, osteocalcin, osteopontin, and collagen I mRNAs was increased by high [Ca2+]o, as was mineralized nodule formation. Alkaline phosphatase activity was maximal for [Ca2+]o between 1.2 and 1.8 mM. Inhibition of CaR by NPS 89636 blocked responses to the CaR agonists. In conclusion, we show that small deviations of [Ca2+]o from physiological values have a profound impact on bone cell fate, by means of the CaR and independently of systemic calciotropic peptides.


Figures
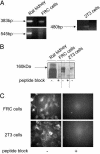
Fig. 1.
Fig. 1.
CaR expression in osteoblastic cells. (A) Two fragments of the extracellular domain of the CaR were amplified by PCR from the FRC cells by using specific, intron-spanning primers. A 480-bp region of the mouse CaR was also amplified from the 2T3 cells. The fragments were sequenced and shown to be homologous to the rat and mouse sequences. (B) CaR immunoblot analysis of 25 μg of crude membrane homogenates from FRC and 2T3 cells showed the expected immunoreactive species for high-mannose monomeric (150-160 kDa) and nonglycosylated monomeric (120 kDa) forms of the receptor (rat kidney, positive control). The bands were ablated when the primary antibody was preabsorbed with the immunizing peptide. (C) High-power immunofluorescence photomicrograph of FRC and 2T3 cells showing peptide-ablatable CaR immunostaining (×400).
Fig. 2.
Fig. 2.
CaR expression in rat femur and human mandible. (A) Bright-field photomicrograph of CaR immunoperoxidase staining in EDTA-decalcified paraffin sections of rat femur show both osteoblast (arrows) and osteocyte (arrowheads) CaR immunoperoxidase staining. (B-D) Photomicrographs of CaR immunofluorescence in cryosections of rat femur show that osteoblasts (B, arrows) and osteocytes (C, arrows) are positive for CaR immunofluorescence. A subpopulation of osteocytes displays canaliculi staining (C, arrowhead). Confocal microscopy reveals a predominantly plasma membrane expression of the CaR (C Inset). (D) Photomicrograph of CaR immunofluorescence in cryosections of human mandible. The CaR immunofluorescence is peptide blockable. (D Inset) Arrow shows the osteocyte staining. (Bars, 20 μm.)
Fig. 3.
Fig. 3.
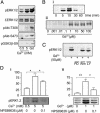
Intracellular signaling in FRC and 2T3 cells. (A) Western blot analysis for ERK phosphorylation/activation was performed by using lysates of cells previously treated with 5 mM Ca2+o or 50 μMGd3+ for 5 min in FRC cells. The treatments did not affect total ERK content. The same treatments elicited Akt phosphorylation at both threonine-308 and serine-473 and GSK3β phosphorylation at serine-9. (B) In FRC cells, Gd3+-induced ERK activation was time- and concentration-dependent (i and ii, respectively). (C) Gd3+-induced ERK phosphorylation was prevented by the mitogen-activated protein kinase inhibitor PD98059 (PD) and was partially inhibited by the phosphatidylinositol 3-kinase kinase inhibitors wortmannin (W) and LY294002 (LY). (D) Both Ca2+o- and Gd3+-induced ERK phosphorylation (i and ii, respectively) are inhibited by the CaR inhibitor NPS 89636. The significant differences are marked by asterisks (*, P < 0.05; **, P < 0.01).
Fig. 4.
Fig. 4.
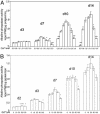
Effects of Ca2+o (A) and Gd3+ (B) on the FRC cell proliferation. (A Upper) FRC cells were grown in increasing concentrations of Ca2+o (0.5, 1.2, 1.8, and 2.5 mM) in triplicate wells and counted three times at different time points. After 1, 3, and 5 days, there were no significant differences between the treatments. Both the 1.8 and the 2.5 mM treatment increased proliferation after 7 (P < 0.05) and 10 (P < 0.05) days. The 0.5 mM Ca2+o treatment decreased proliferation after 7 (P < 0.05) and 10 (P < 0.001) days. The Ca2+o-induced proliferation was inhibited by the CaR antagonist NPS 89636 after 10 days of treatment (n = 3; P < 0.05; Lower). (B Upper) FRC cells chronically treated with 25 μMGd3+ increased proliferation after 14 days of treatment (P < 0.05). The 50 μM dose significantly increased proliferation after 5 (P < 0.05), 7 (P < 0.05), 10 (P < 0.01), and 14 (P < 0.01) days of treatment. This response is inhibited by the CaR antagonist NPS 89636 after 10 days of treatment (n = 3; P < 0.05; Lower).
Fig. 5.
Fig. 5.
Effects of Ca2+o and Gd3+ on osteoblast promoter activity and gene expression. (A) 2T3 cells stably expressing the collaI promoter GFP constructs were grown in increasing concentrations of Ca2+o (Left) and Gd3+ (Right, baseline Ca2+o is 1.2 mM) for 24 h (n = 4). The significant differences with regard to the 1.2 mM Ca2+o control are marked by asterisks (*, P < 0.05; **, P < 0.01; ***, P < 0.001). (B and C) Total RNA was extracted from the cells grown in 0.5, 1.2, 1.8, and 2.5 mM Ca2+o and 1.2 mM and 50 μM Gd3+ at different time points (days 1, 3, 7, 12, and 18) and subjected to Northern analysis with the appropriate cDNA probes for collaI, Cbfa1, OC, OP, and β-actin (control).
Fig. 6.
Fig. 6.
AlP activity in FRC cells treated with Ca2+o (A)orGd3+ (B). (A) FRC cells were grown in increasing concentrations of [Ca2+]o and assayed for AlP activity. Raising the [Ca2+]o from 1.2 mM to 1.8 mM decreased the activity of AlP after 7 days of treatment (n = 6; P < 0.01). Increasing the [Ca2+]o to 2.5 mM and to 3 mM decreased AlP activity further. Lowering the [Ca2+]o from 1.2 mM to 0.8 mM and furthermore to 0.5 mM also decreased the activity of AlP significantly across the time points measured. (B) In the presence of 1.2 mM Ca2+o, Gd3+ (25-100 μM) increased AlP activity in FRC cells after 2 days of treatment (n = 6; P < 0.05 for 25 and 100 μM and P < 0.001 for 50 μM). However, this effect was transient, and, after 3 days, 100 μM Gd3+ decreased the enzyme activity. No differences were observed after 18 days of treatment. The significant differences with regard to the control are marked by asterisks (*, P < 0.05; **, P < 0.01; ***, P < 0.001).
Fig. 7.
Fig. 7.
Effects of extracellular Ca2+o (A)orGd3+ (B) on the FRC cell mineralized nodule formation (von Kossa staining). (A) FRC cells grown in the presence of ascorbic acid and β-glycerophosphate for 21 days showed a [Ca2+]o-dependent increase in the formation mineralized nodule number and area (n = 6; P < 0.01). The Ca2+o EC50 for both the number and the area occupied by the mineralized nodules was ≈1.1 mM. (B) Twenty-one-day treatment of FRC cells with 50 μMGd3+ (baseline Ca2+, 1.2 mM) significantly increased the production of mineralized nodules (n = 3; P < 0.05). (C) The Ca2+o-induced mineralization is inhibited by the CaR inhibitor NPS 89636.

References

    1. Parfitt, A. M. (1987) Bone 8, Suppl. 1, S1-S8. - PubMed
    1. Godwin, S. L. & Soltoff, S. P. (1997) J. Biol. Chem. 272, 11307-11312. - PubMed
    1. Yamaguchi, T., Chattopadhyay, N., Kifor, O., Butters, R. R., Jr., Sugimoto, T. & Brown, E. M. (1998) J. Bone Miner. Res. 13, 1530-1538. - PubMed
    1. Eklou-Kalonji, E., Denis, I., Lieberherr, M. & Pointillart, A. (1998) Cell Tissue Res. 292, 163-171. - PubMed
    1. Nakade, O., Takahashi, K., Takuma, T., Aoki, T. & Kaku, T. (2001) J. Bone Miner. Metab. 19, 13-19. - PubMed

Publication types

LinkOut - more resources