

Signatures of selection among sex-determining alleles of the honey bee
- PMID: 15051879
- PMCID: PMC387344
- DOI: 10.1073/pnas.0307147101
Signatures of selection among sex-determining alleles of the honey bee
Abstract
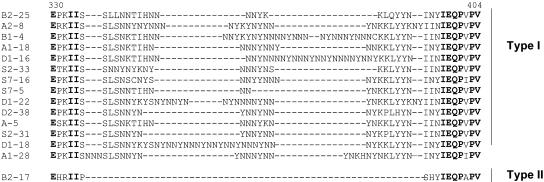
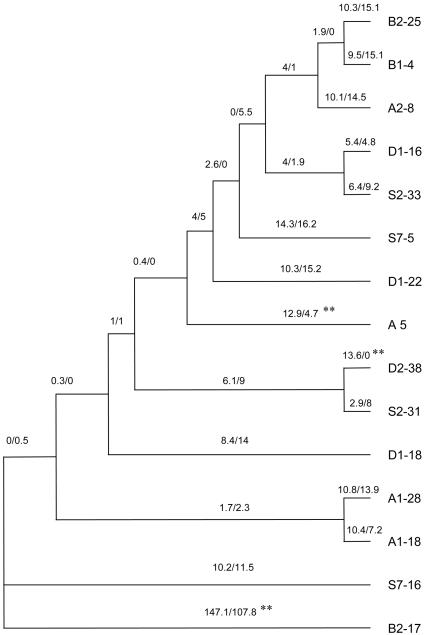
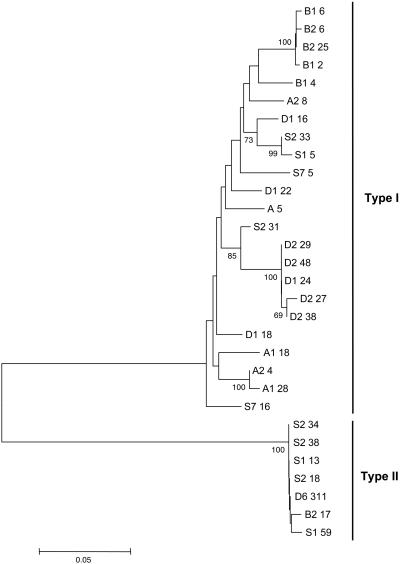
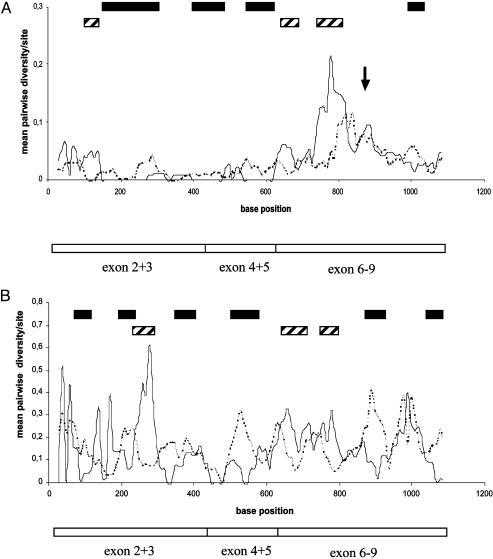
Patterns of DNA polymorphisms are a primary tool for dissecting signatures of selection; however, the underlying selective forces are poorly understood for most genes. A classical example of diversifying selection is the complementary sex-determining locus that is found in the very large insect order Hymenoptera (bees, wasps, ants, and sawflies). The gene responsible for sex determination, the complementary sex determiner (csd), has been most recently identified in the honey bee. Females are heterozygous at this locus. Males result when there is only one functional allele present, as a result of either homozygosity (fertilized eggs) or, more commonly, hemizygosity (unfertilized eggs). The homozygotes, diploid males, do not reproduce and have zero fitness, which implies positive selection in favor of rare alleles. Large differences in csd cDNA sequences within and between four populations were found that fall into two major groups, types I and II. Type I consists of several allelic lineages that were maintained over an extended period, an indication of balancing selection. Diversifying selection has operated on several confined parts of the protein, as shown by an excess of nonsynonymous differences. Elevated sequence differences indicate another selected part near a repeat region. These findings have general implications about the understanding of both the function of the multiallelic mechanism and the adaptive processes on the level of nucleotide sequences. Moreover, the first csd sequence data are a notable basis for the avoidance of diploid males in bee selection programs by allele-assisted breeding.
Figures
References
-
- Bull, J. J. (1983) Evolution of Sex Determining Mechanisms (Benjamin Cummings, Menlo Park, CA).
-
- Cook, J. M. (1993) Heredity 71, 421–435.
-
- Woyke, J. & Skowronek, W. (1967) Proc. XXI Internatl. Apic. Congr., Maryland (Apimondia, Bucharest), pp. 470–471.
-
- Awadalla, P. (2003) Nat. Rev. Genet 4, 50–60. - PubMed
-
- Duchateau, M. J. & Marien, J. (1995) Insectes Soc. 42, 255–266.
Publication types
MeSH terms
Substances
Associated data
- Actions
- Actions
- Actions
- Actions
- Actions
- Actions
- Actions
- Actions
- Actions
- Actions
- Actions
- Actions
- Actions
- Actions
- Actions
- Actions
- Actions
- Actions
- Actions
- Actions
- Actions
- Actions
- Actions
- Actions
- Actions
- Actions
- Actions
- Actions
- Actions
- Actions
LinkOut - more resources
Full Text Sources
