

MiCoViTo: a tool for gene-centric comparison and visualization of yeast transcriptome states
- PMID: 15053844
- PMCID: PMC375526
- DOI: 10.1186/1471-2105-5-20
MiCoViTo: a tool for gene-centric comparison and visualization of yeast transcriptome states
Abstract
Background: Information obtained by DNA microarray technology gives a rough snapshot of the transcriptome state, i.e., the expression level of all the genes expressed in a cell population at any given time. One of the challenging questions raised by the tremendous amount of microarray data is to identify groups of co-regulated genes and to understand their role in cell functions.
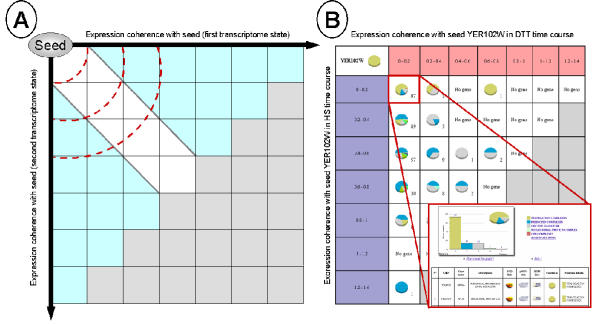
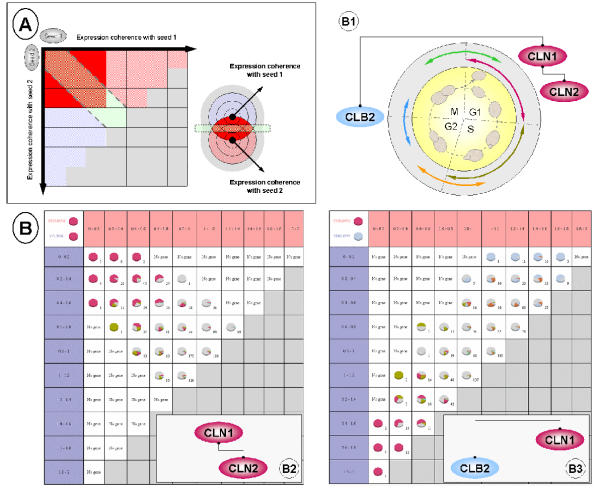
Results: MiCoViTo (Microarray Comparison Visualization Tool) is a set of biologists' tools for exploring, comparing and visualizing changes in the yeast transcriptome by a gene-centric approach. A relational database includes data linked to genome expression and graphical output makes it easy to visualize clusters of co-expressed genes in the context of available biological information. To this aim, upload of personal data is possible and microarray data from fifty publications dedicated to S. cerevisiae are provided on-line. A web interface guides the biologist during the usage of this tool and is freely accessible at http://www.transcriptome.ens.fr/micovito/.
Conclusions: MiCoViTo offers an easy-to-read picture of local transcriptional changes connected to current biological knowledge. This should help biologists to mine yeast microarray data and better understand the underlying biology. We plan to add functional annotations from other organisms. That would allow inter-species comparison of transcriptomes via orthology tables.
Figures
Similar articles
-
DNA microarray data and contextual analysis of correlation graphs.BMC Bioinformatics. 2003 Apr 29;4:15. doi: 10.1186/1471-2105-4-15. Epub 2003 Apr 29. BMC Bioinformatics. 2003. PMID: 12720549 Free PMC article.
-
Correlation and prediction of gene expression level from amino acid and dipeptide composition of its protein.BMC Bioinformatics. 2005 Mar 17;6:59. doi: 10.1186/1471-2105-6-59. BMC Bioinformatics. 2005. PMID: 15773999 Free PMC article.
-
MILANO--custom annotation of microarray results using automatic literature searches.BMC Bioinformatics. 2005 Jan 20;6:12. doi: 10.1186/1471-2105-6-12. BMC Bioinformatics. 2005. PMID: 15661078 Free PMC article.
-
Transcriptional networks: reverse-engineering gene regulation on a global scale.Curr Opin Microbiol. 2004 Dec;7(6):638-46. doi: 10.1016/j.mib.2004.10.009. Curr Opin Microbiol. 2004. PMID: 15556037 Review.
-
Toxicogenomics using yeast DNA microarrays.J Biosci Bioeng. 2010 Nov;110(5):511-22. doi: 10.1016/j.jbiosc.2010.06.003. Epub 2010 Jul 10. J Biosci Bioeng. 2010. PMID: 20624688 Review.
Cited by
-
MADIBA: a web server toolkit for biological interpretation of Plasmodium and plant gene clusters.BMC Genomics. 2008 Feb 28;9:105. doi: 10.1186/1471-2164-9-105. BMC Genomics. 2008. PMID: 18307768 Free PMC article.
-
Integration and mining of malaria molecular, functional and pharmacological data: how far are we from a chemogenomic knowledge space?Malar J. 2006 Nov 17;5:110. doi: 10.1186/1475-2875-5-110. Malar J. 2006. PMID: 17112376 Free PMC article. Review.
References
-
- Lee TI, Rinaldi NJ, Robert F, Odom DT, Bar-Joseph Z, Gerber GK, Hannett NM, Harbison CT, Thompson CM, Simon I, Zeitlinger J, Jennings EG, Murray HL, Gordon DB, Ren B, Wyrick JJ, Tagne JB, Volkert TL, Fraenkel E, Gifford DK, Young RA. Transcriptional regulatory networks in Saccharomyces cerevisiae. Science. 2002;298:799–804. doi: 10.1126/science.1075090. - DOI - PubMed
Publication types
MeSH terms
LinkOut - more resources
Full Text Sources
Molecular Biology Databases
