. 2004 Feb 25:5:18.
doi: 10.1186/1471-2105-5-18.

Quantifying the relationship between co-expression, co-regulation and gene function

Affiliations

Quantifying the relationship between co-expression, co-regulation and gene function

Dominic J Allocco et al. BMC Bioinformatics. .

Abstract

Background: It is thought that genes with similar patterns of mRNA expression and genes with similar functions are likely to be regulated via the same mechanisms. It has been difficult to quantitatively test these hypotheses on a large scale because there has been no general way of determining whether genes share a common regulatory mechanism. Here we use data from a recent genome wide binding analysis in combination with mRNA expression data and existing functional annotations to quantify the likelihood that genes with varying degrees of similarity in mRNA expression profile or function will be bound by a common transcription factor.

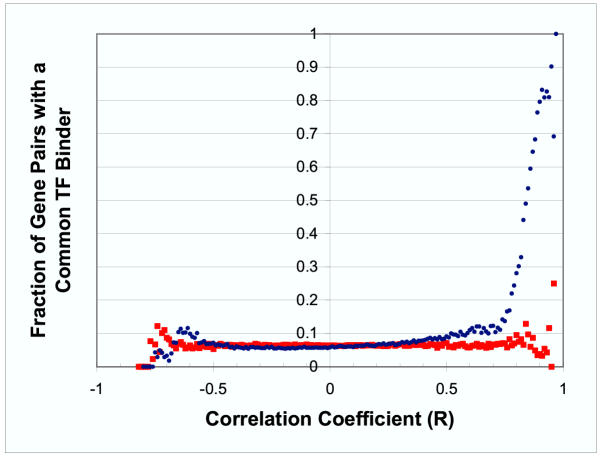
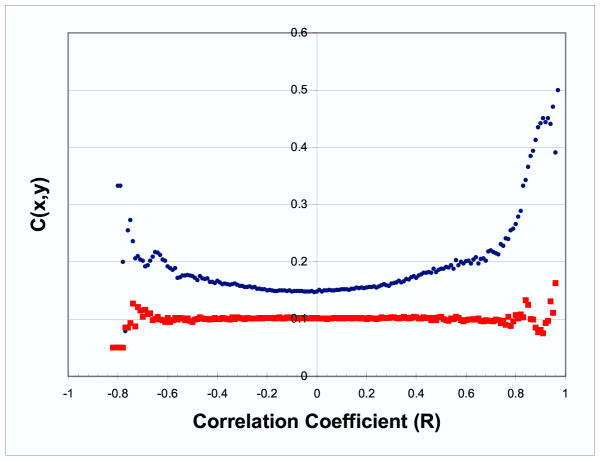
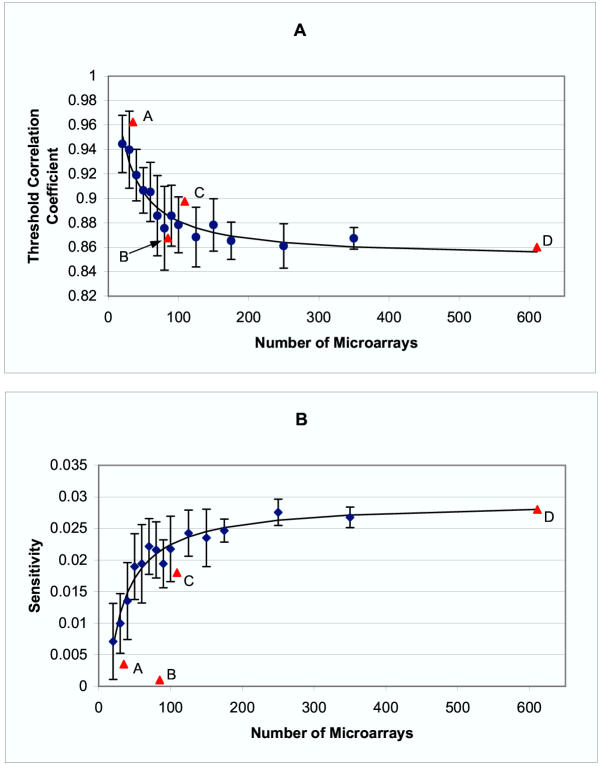
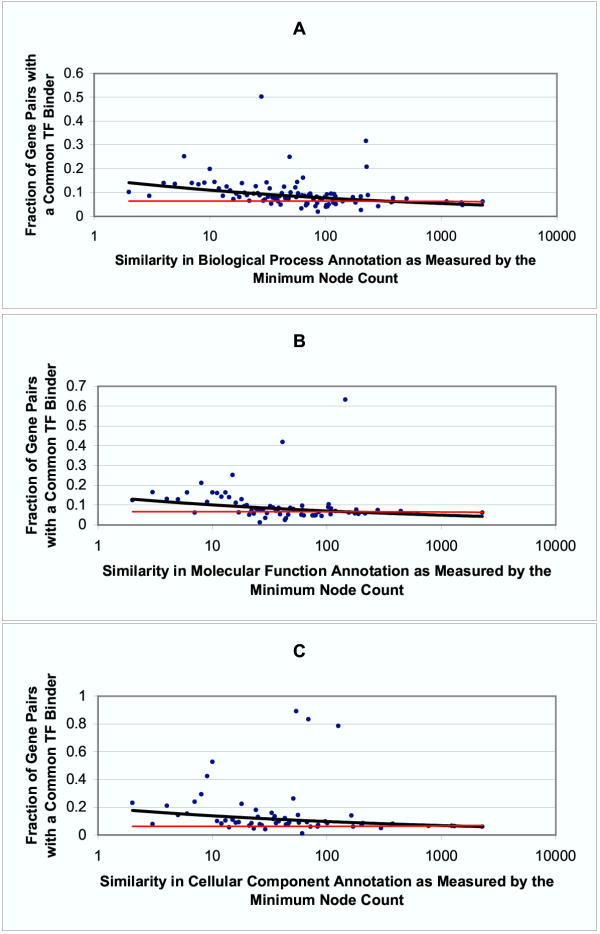
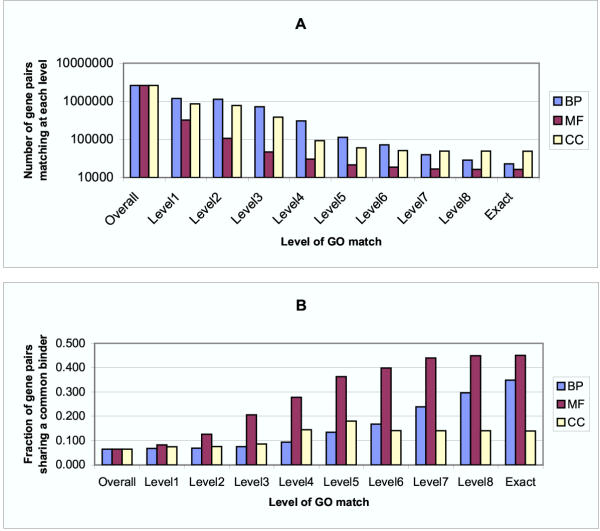
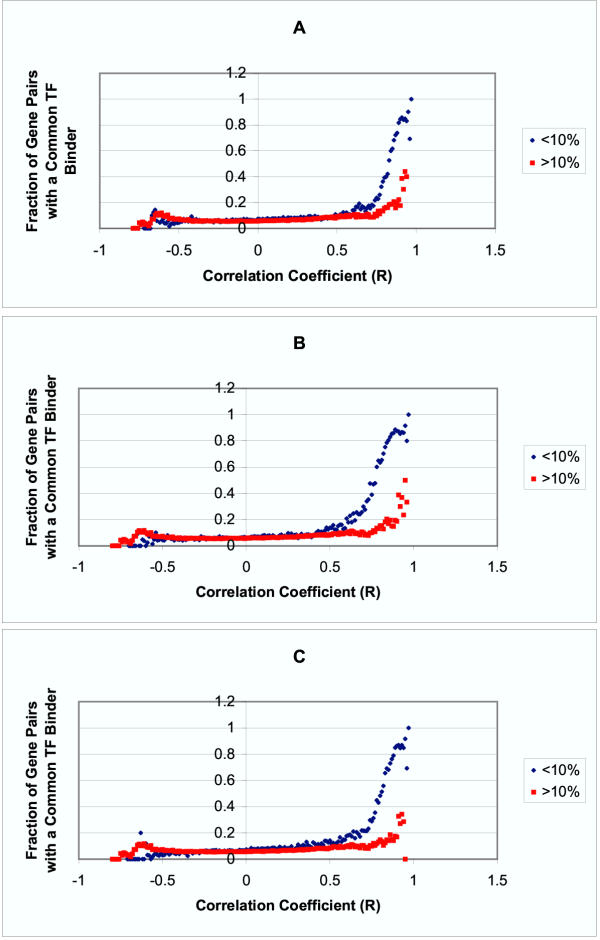
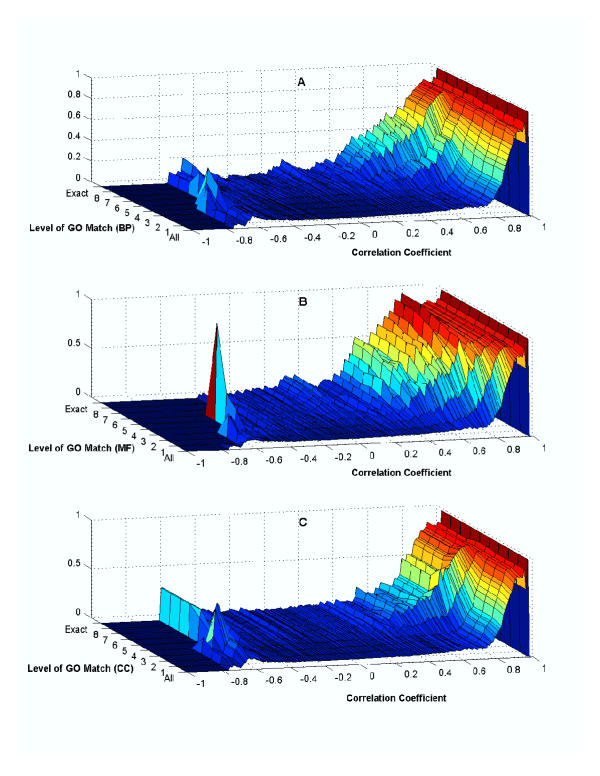
Results: Genes with strongly correlated mRNA expression profiles are more likely to have their promoter regions bound by a common transcription factor. This effect is present only at relatively high levels of expression similarity. In order for two genes to have a greater than 50% chance of sharing a common transcription factor binder, the correlation between their expression profiles (across the 611 microarrays used in our study) must be greater than 0.84. Genes with similar functional annotations are also more likely to be bound by a common transcription factor. Combining mRNA expression data with functional annotation results in a better predictive model than using either data source alone.

Conclusions: We demonstrate how mRNA expression data and functional annotations can be used together to estimate the probability that genes share a common regulatory mechanism. Existing microarray data and known functional annotations are sufficient to identify only a relatively small percentage of co-regulated genes.


Figures

Figure 1
Figure 1
Fraction of Gene Pairs Sharing a Common Transcription Factor Binder vs. Correlation Coefficient In this figure each point represents a ratio – the denominator is the number of gene pairs where correlation in expression profile is between x and x+.01 and the numerator is the number of those gene pairs that share a common transcription factor. The actual yeast data is represented by blue ● and the control data (where the mapping between genes and promoters is permuted) by red ■. The observed fraction of gene pairs sharing a common transcription factor increases when the correlation between the expression profiles of the two genes is high.
Figure 2
Figure 2
Regulatory Closeness vs. Correlation Coefficient Each point shows the mean regulatory closeness for gene pairs whose correlation in expression profile is between x and x+.01. The actual yeast data is represented by blue ● and the control data (where the mapping between genes and promoters is permuted) by red ■. The mean regulatory closeness c(X,Y) increases with the absolute value of the correlation between the expression profiles of genes X and Y.
Figure 3
Figure 3
Threshold Correlation Coefficient and Sensitivity vs. Number of Microarrays Labeled data points represent selected subsets as follows: A – starvation, B – cell cycle, C – stress response, D – all data. All other data points, marked by blue ●, indicate the mean value for 10 randomly selected data sets of the given size. The bars show one standard deviation. The curves shown are fit using only the randomly chosen subsets. A) The threshold correlation coefficient r, chosen such that 75% of all gene pairs with correlation greater than r share a common transcription factor, decreases as the number of microarrays increases. B) Sensitivity (the ratio of the number of gene pairs which both share a common transcription factor and have an expression correlation greater than r to the total number of gene pairs which share a common transcription factor) when threshold correlation is chosen such that positive predictive value is 75%, increases with the number of microarrays used up to a limit of 2.8%. Random sets of microarrays showed greater sensitivity for finding gene pairs bound by a common transcription factor than predetermined sets of microarrays.
Figure 4
Figure 4
Co-regulation vs. Functional Similarity as Defined by Minimum Node Count A, B and C were created using the biological process, molecular function and cellular component ontologies, respectively. The dark black lines are fit using the actual yeast data (individual data points represented as blue ●). The thin red lines are fit using data where the mapping between genes and their promoters is permuted. For clarity, the individual data points representing permuted data are not shown. For each of the three ontologies, the fraction of gene pairs sharing a common transcription factor binder increases as functional similarity increases (i.e. as the minimum node count decreases).
Figure 5
Figure 5
Co-regulation vs. Functional Similarity as Defined by Level of GO Term Match BP, MF and CC refer to the biological process, molecular function and cellular component ontologies, respectively. A) The number of gene pairs which have matching GO terms decreases as the strictness of the required match increases. B) The fraction of gene pairs sharing a common transcription factor binder increases as the level of functional similarity increases, particularly for the BP and MF ontologies.
Figure 6
Figure 6
Co-regulation vs. Co-expression and Functional Similarity as Defined by Minimum Node Count A, B and C were created using the biological process, molecular function and cellular component ontologies, respectively. For each of the three ontologies, the gene pairs are divided into two groups – those with minimum node counts less than the 10th percentile and greater than the 10th percentile. At higher levels of correlation in expression profile, gene pairs with greater functional similarity are more likely to share a common transcription factor binder.
Figure 7
Figure 7
Co-regulation vs. Co-expression and Functional Similarity as Defined by Level of GO Term Match A, B and C were created using the biological process, molecular function and cellular component ontologies, respectively. For each of the three ontologies, the fraction of gene pairs sharing a common transcription factor binder is shown as a function of both correlation in expression profile and the level of GO term match.

References

    1. Schulze A, Downward J. Navigating gene expression using microarrays–a technology review. Nat Cell Biol. 2001;3:E190–5. doi: 10.1038/35087138. - DOI - PubMed
    1. Altman RB, Raychaudhuri S. Whole-genome expression analysis: challenges beyond clustering. Curr Opin Struct Biol. 2001;11:340–7. doi: 10.1016/S0959-440X(00)00212-8. - DOI - PubMed
    1. Brazma A, Jonassen I, Vilo J, Ukkonen E. Predicting gene regulatory elements in silico on a genomic scale. Genome Res. 1998;8:1202–15. - PMC - PubMed
    1. Tavazoie S, Hughes JD, Campbell MJ, Cho RJ, Church GM. Systematic determination of genetic network architecture. Nat Genet. 1999;22:281–5. doi: 10.1038/10343. - DOI - PubMed
    1. Wolfsberg TG, Gabrielian AE, Campbell MJ, Cho RJ, Spouge JL, Landsman D. Candidate regulatory sequence elements for cell cycle-dependent transcription in Saccharomyces cerevisiae. Genome Res. 1999;9:775–92. - PMC - PubMed

Publication types

MeSH terms

Substances