

Trends and socioeconomic inequalities in cancer survival in England and Wales up to 2001
- PMID: 15054456
- PMCID: PMC2409687
- DOI: 10.1038/sj.bjc.6601696
Trends and socioeconomic inequalities in cancer survival in England and Wales up to 2001
Abstract
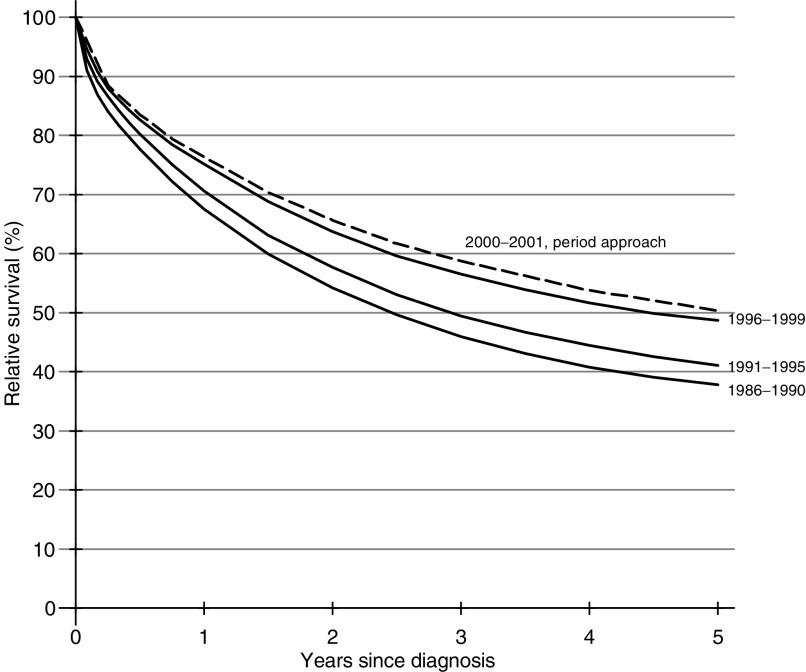
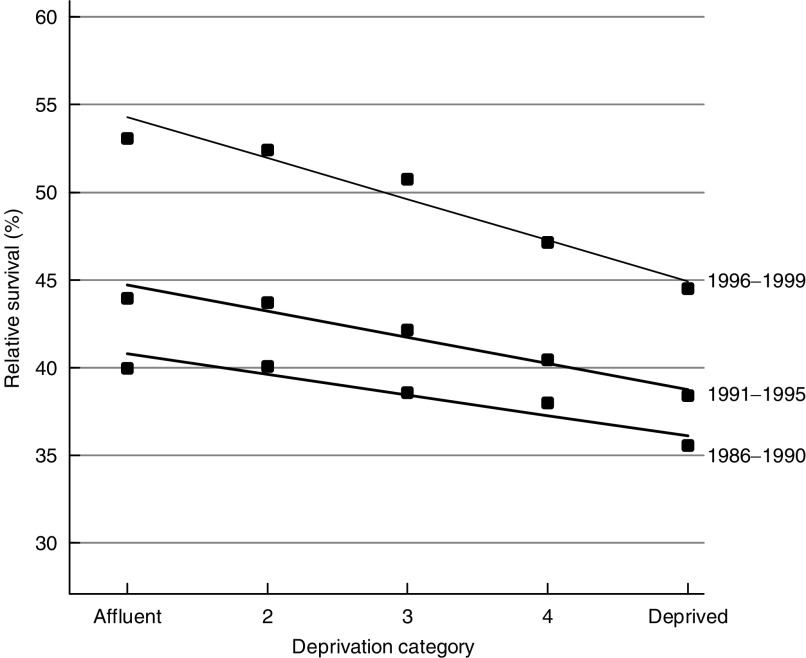
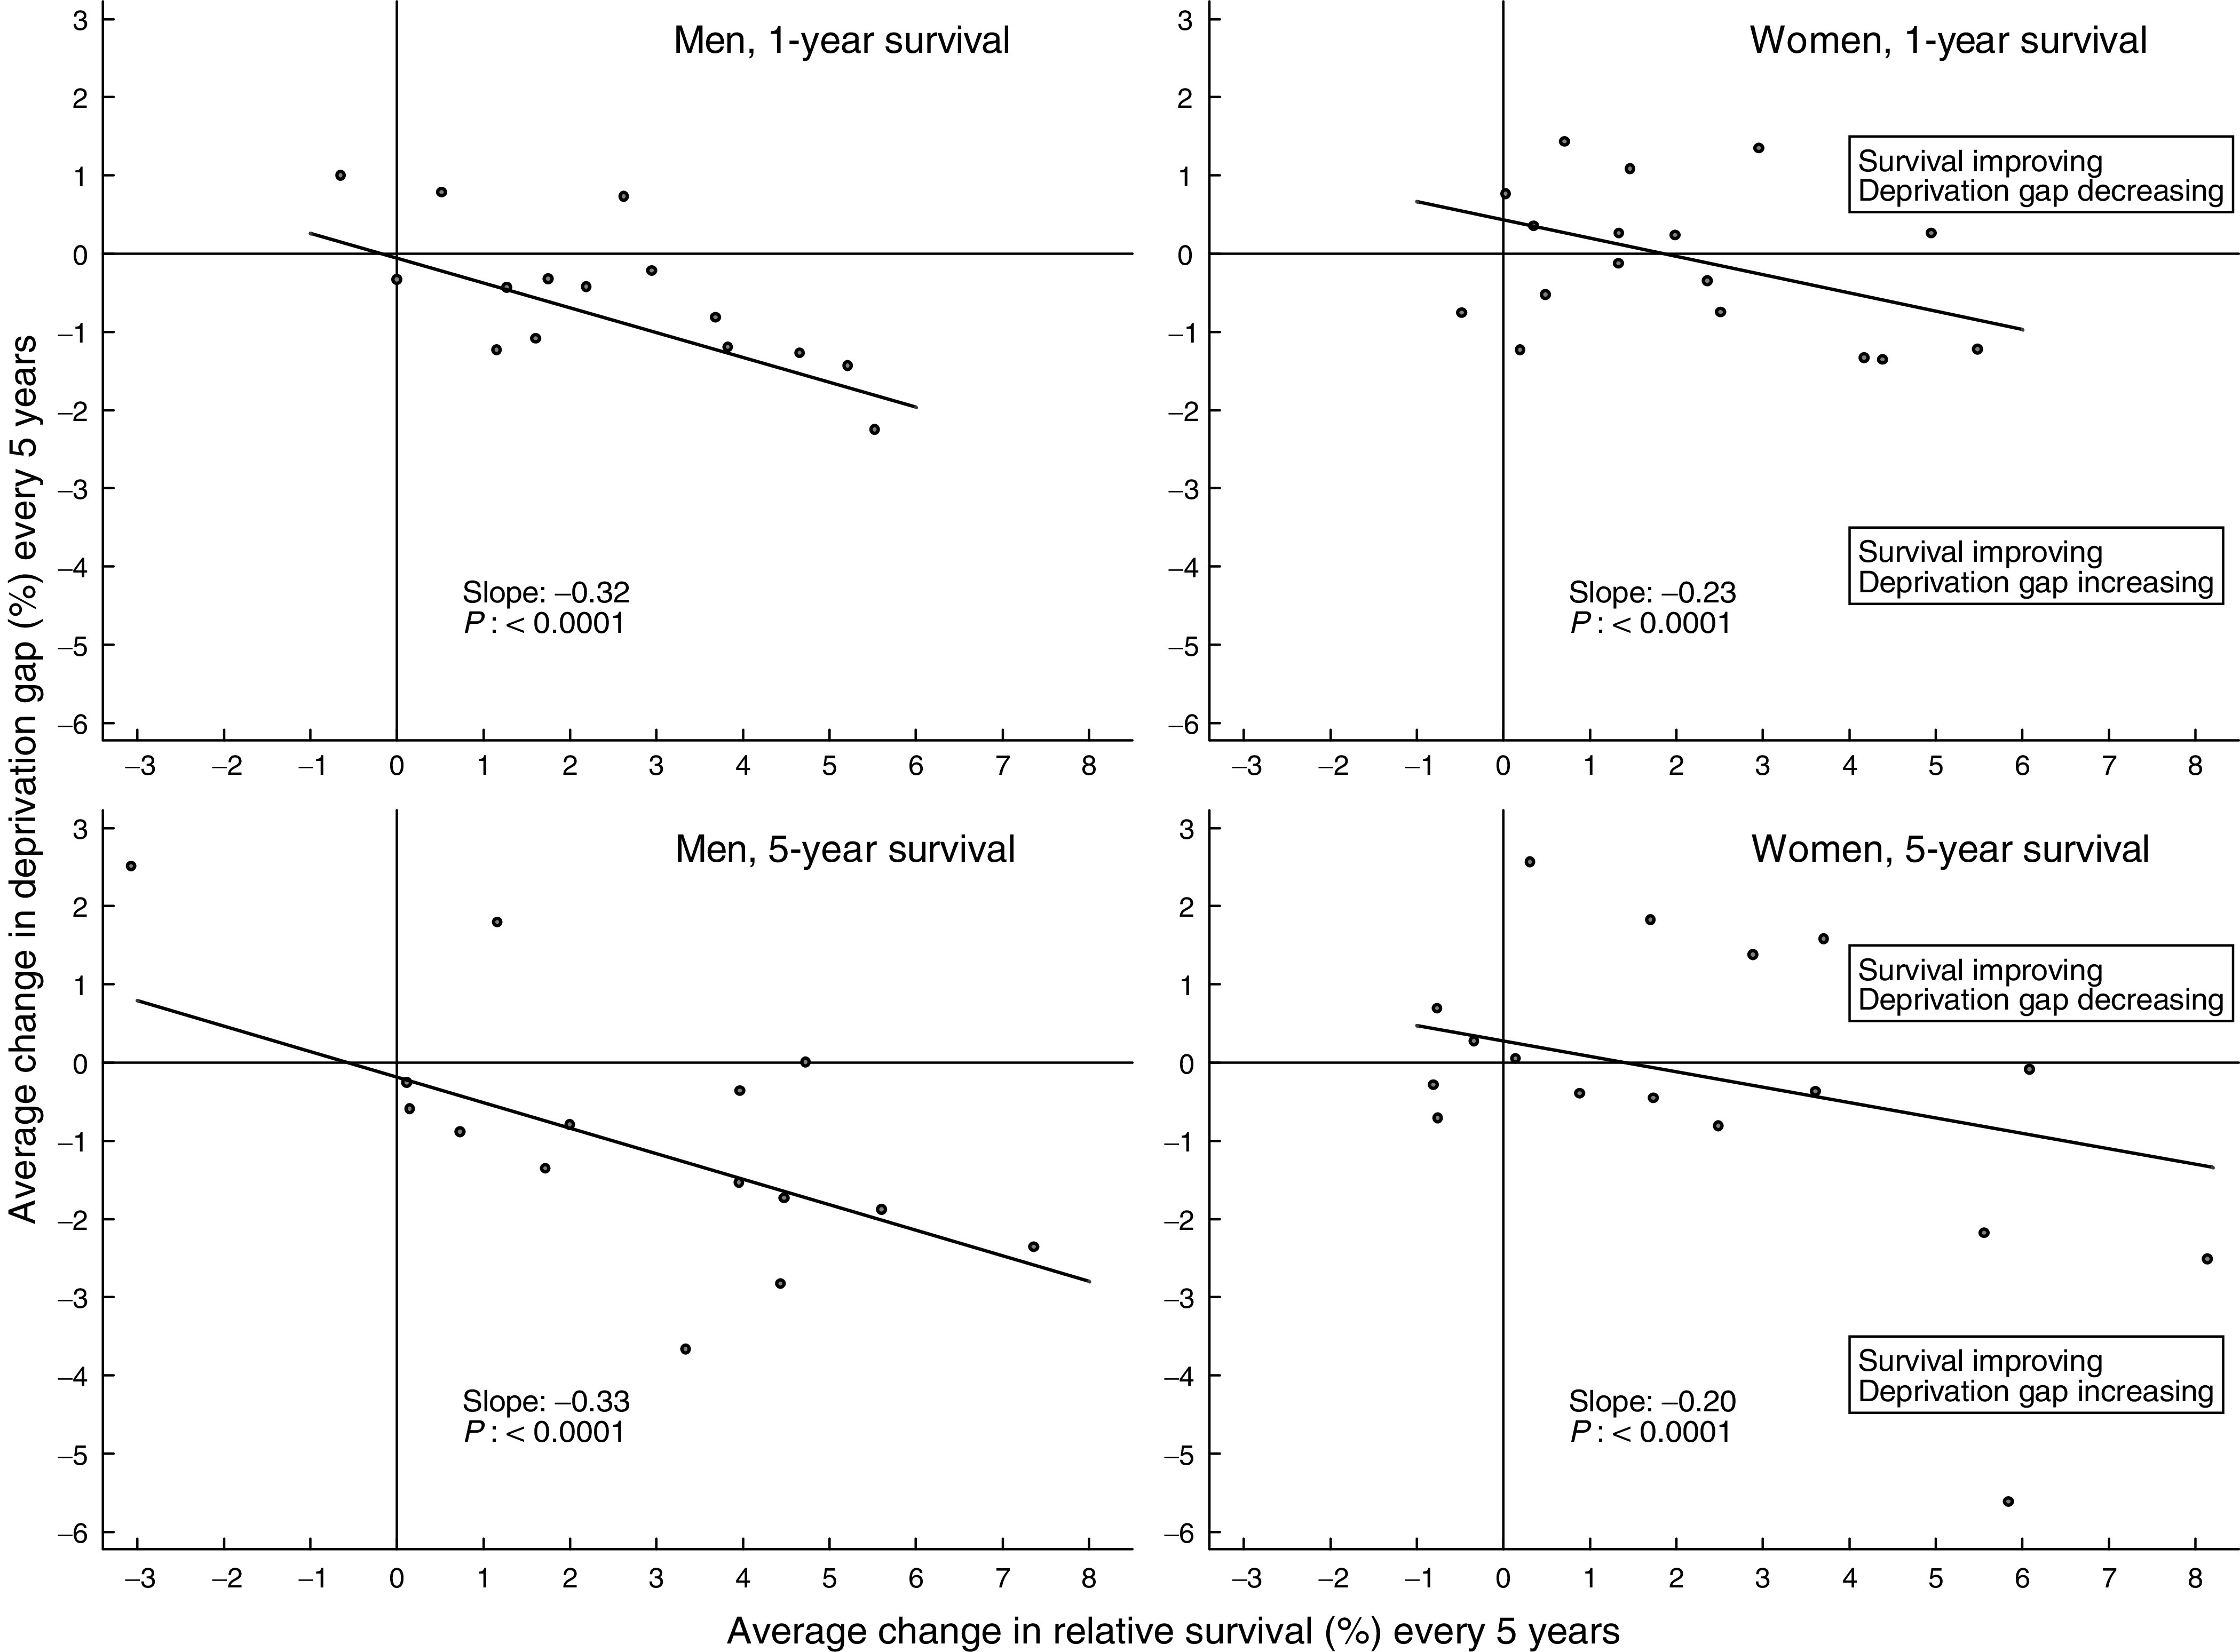
We examined national trends and socioeconomic inequalities in cancer survival in England and Wales during the 1990s, using population-based data on 2.2 million patients who were diagnosed with one of the 20 most common cancers between 1986 and 1999 and followed up to 2001. Patients were assigned to one of five deprivation categories (from 'affluent' to 'deprived') using characteristics of their electoral ward of residence at diagnosis. We estimated relative survival up to 5 years after diagnosis, adjusting separately in each deprivation category for background mortality by age, sex and calendar period. We estimated trends in survival and in the difference in survival between deprivation categories ('deprivation gap') over the periods 1986-90, 1991-95 and 1996-99. We used period analysis to examine likely survival rates in the near future. Survival improved for most cancers in both sexes during the 1990s, and appears likely to continue improving for most cancers in the near future. The deprivation gap in survival between rich and poor was wider for patients diagnosed in the late 1990s than in the late 1980s. Increases in cancer survival in England and Wales during the 1990s are shown to be significantly associated with a widening deprivation gap in survival.
Figures
References
-
- Berkson J, Gage RP (1950) Calculation of survival rates for cancer. Proc Staff Meet Mayo Clinic 25: 270–286 - PubMed
-
- Brenner H, Gefeller O (1996) An alternative approach to monitoring cancer patient survival. Cancer 78: 2004–2010 - PubMed
-
- Coleman MP, Babb P, Damiecki P, Grosclaude P, Honjo S, Jones J, Knerer G, Pitard A, Quinn MJ, Sloggett A, De Stavola BL (1999) Cancer Survival Trends in England and Wales 1971–1995: Deprivation and NHS Region, Series SMPS No. 61. London: The Stationery Office
-
- Coleman MP, Gatta G, Verdecchia A, Estève J, Sant M, Storm H, Allemani C, Ciccolallo L, Santaquilani M, Berrino F, EUROCARE Working Group (2003) EUROCARE-3 summary: cancer survival in Europe at the end of the 20th century. Ann Oncol 14: 128v–149 - PubMed
MeSH terms
LinkOut - more resources
Full Text Sources
Medical
Miscellaneous
