

Immune profiling of leprosy and tuberculosis patients to 15-mer peptides of Mycobacterium leprae and M. tuberculosis GroES in a BCG vaccinated area: implications for development of vaccine and diagnostic reagents
- PMID: 15056384
- PMCID: PMC1782444
- DOI: 10.1111/j.0019-2805.2004.01839.x
Immune profiling of leprosy and tuberculosis patients to 15-mer peptides of Mycobacterium leprae and M. tuberculosis GroES in a BCG vaccinated area: implications for development of vaccine and diagnostic reagents
Abstract
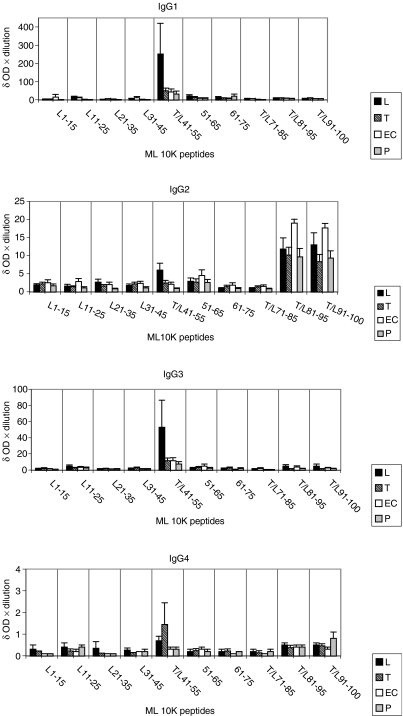
Mycobacterium leprae (ML) GroES has been shown to induce strong T cell responses in tuberculoid as well as in exposed healthy contacts of leprosy patients, and therefore this antigen has been the focus of study as a potential vaccine candidate. Paradoxically, we have shown that ML GroES also induces extremely high titres of IgG1 antibody in leprosy patients across the disease spectrum, a response associated with disease progression. IgG1 antibodies in leprosy also show a negative association with interferon-gamma, a critical T cell cytokine responsible for macrophage activation and intracellular killing of mycobacteria. We therefore queried if antibody and T cell responses were being evoked by different epitopes in ML GroES proteins. To address the issue of epitope recognition in mycobacterial diseases, we have analysed 16 peptides (15-mer peptides) spanning the entire ML and M. tuberculosis GroES protein in leprosy (n = 19) and tuberculosis (n = 9) patients and healthy endemic controls (n = 8). Our analysis demonstrates clearly that the dominant peptides evokingT cell and IgG subclass antibodies were different. The target of both T and B cell responses were cross-reactive epitopes in all groups. Differences in disease and healthy states related to the strength (mean intensity) of the T cell and antibody response. IgG1 and IgG3 antibodies were associated with disseminated disease and IgG 2 and IgG4 with disease limitation. Such comprehensive immune profiling of antigen-specific responses is critical to understanding the disease pathogenesis and also if these reagents are to be exploited for either diagnostic or vaccine purposes.
Figures


Similar articles
-
Rational combination of peptides derived from different Mycobacterium leprae proteins improves sensitivity for immunodiagnosis of M. leprae infection.Clin Vaccine Immunol. 2008 Mar;15(3):522-33. doi: 10.1128/CVI.00432-07. Epub 2008 Jan 16. Clin Vaccine Immunol. 2008. PMID: 18199740 Free PMC article.
-
Analysis of T-cell and B-cell responses to recombinant M. leprae antigens in leprosy patients and in healthy contacts: significant T-cell responses to antigens in M. leprae nonresponders.Int J Lepr Other Mycobact Dis. 1995 Sep;63(3):369-80. Int J Lepr Other Mycobact Dis. 1995. PMID: 7594920
-
T cell responses to fractionated Mycobacterium leprae antigens in leprosy. The lepromatous nonresponder defect can be overcome in vitro by stimulation with fractionated M. leprae components.Eur J Immunol. 1989 Apr;19(4):707-13. doi: 10.1002/eji.1830190421. Eur J Immunol. 1989. PMID: 2659369
-
HLA and leprosy in the pre and postgenomic eras.Hum Immunol. 2006 Jun;67(6):439-45. doi: 10.1016/j.humimm.2006.03.009. Epub 2006 Apr 3. Hum Immunol. 2006. PMID: 16728267 Review.
-
M. leprae recombinant antigens important for T-cell reactivity.Indian J Lepr. 1999 Jan-Mar;71(1):75-86. Indian J Lepr. 1999. PMID: 10439328 Review.
Cited by
-
Biotechnological and Immunological Platforms Based on PGL-I Carbohydrate-Like Peptide of Mycobacterium leprae for Antibodies Detection Among Leprosy Clinical Forms.Front Microbiol. 2020 Mar 17;11:429. doi: 10.3389/fmicb.2020.00429. eCollection 2020. Front Microbiol. 2020. PMID: 32256479 Free PMC article.
-
Immunodiagnosis of tuberculosis: a dynamic view of biomarker discovery.Clin Microbiol Rev. 2011 Oct;24(4):792-805. doi: 10.1128/CMR.00014-11. Clin Microbiol Rev. 2011. PMID: 21976609 Free PMC article. Review.
-
Serologic reactivity to the emerging pathogen Granulibacter bethesdensis.J Infect Dis. 2012 Sep 15;206(6):943-51. doi: 10.1093/infdis/jis431. Epub 2012 Jul 10. J Infect Dis. 2012. PMID: 22782953 Free PMC article.
-
HSP60 mimetic peptides from Mycobacterium leprae as new antigens for immunodiagnosis of Leprosy.AMB Express. 2023 Oct 27;13(1):120. doi: 10.1186/s13568-023-01625-9. AMB Express. 2023. PMID: 37891336 Free PMC article.
-
Gene expression profile and immunological evaluation of unique hypothetical unknown proteins of Mycobacterium leprae by using quantitative real-time PCR.Clin Vaccine Immunol. 2013 Feb;20(2):181-90. doi: 10.1128/CVI.00419-12. Epub 2012 Dec 12. Clin Vaccine Immunol. 2013. PMID: 23239802 Free PMC article.
References
-
- Romani L, Mencacci A, Cenci E, Spaccapelo R, Mosci P, Puccetti P, Bistoni F. CD4+ subset expression in murine Candidiasis: Th responses correlate directly with genetically determined susceptibility or vaccine-induced resistance. J Immunol. 1993;150:925–31. - PubMed
Publication types
MeSH terms
Substances
LinkOut - more resources
Full Text Sources
Other Literature Sources
Medical
Molecular Biology Databases
Miscellaneous