Comparative Study
. 2004 Jun 25;279(26):27621-32.
doi: 10.1074/jbc.M402980200. Epub 2004 Mar 31.

Neuronal microtubule-associated protein 2D is a dual a-kinase anchoring protein expressed in rat ovarian granulosa cells

Affiliations
Comparative Study

Neuronal microtubule-associated protein 2D is a dual a-kinase anchoring protein expressed in rat ovarian granulosa cells

Lisa M Salvador et al. J Biol Chem. .

Abstract

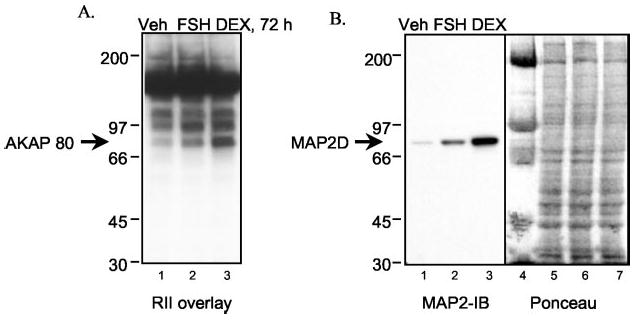
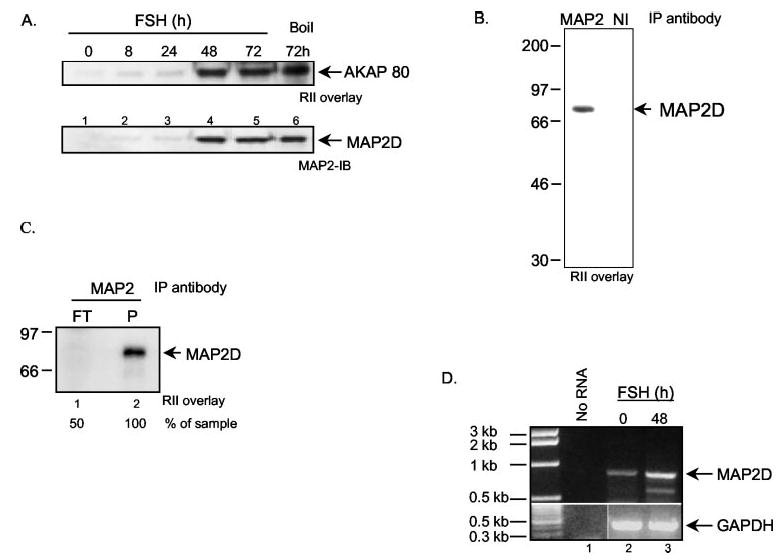
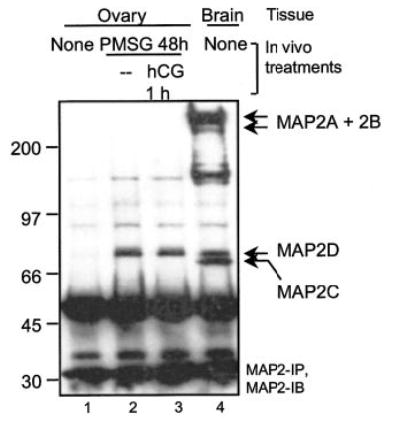
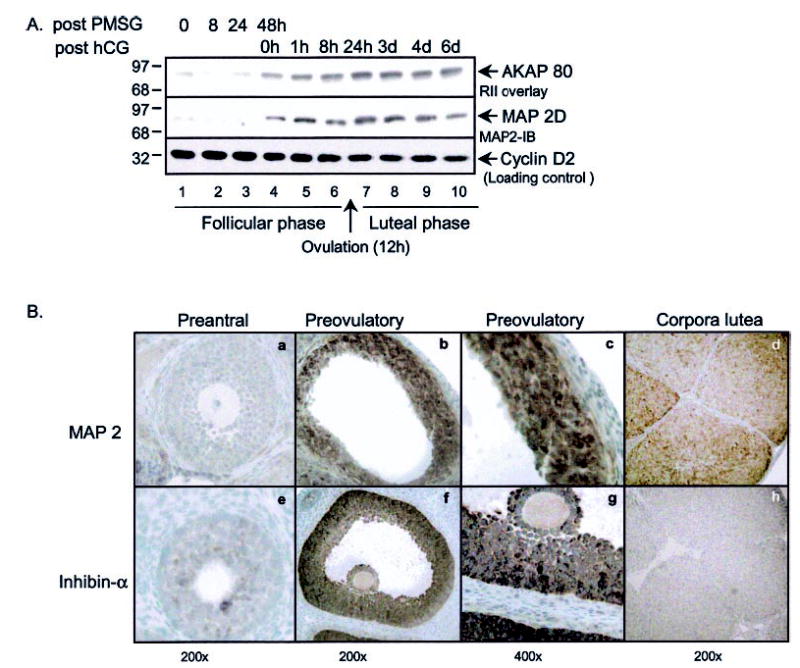
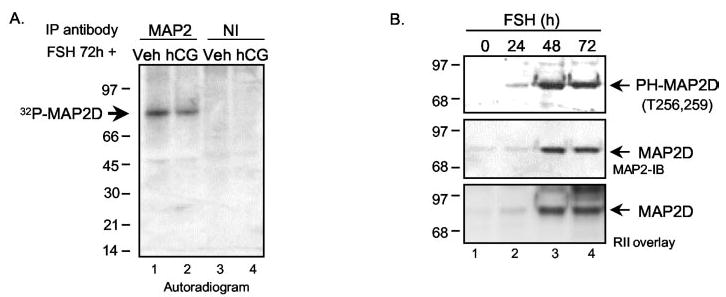
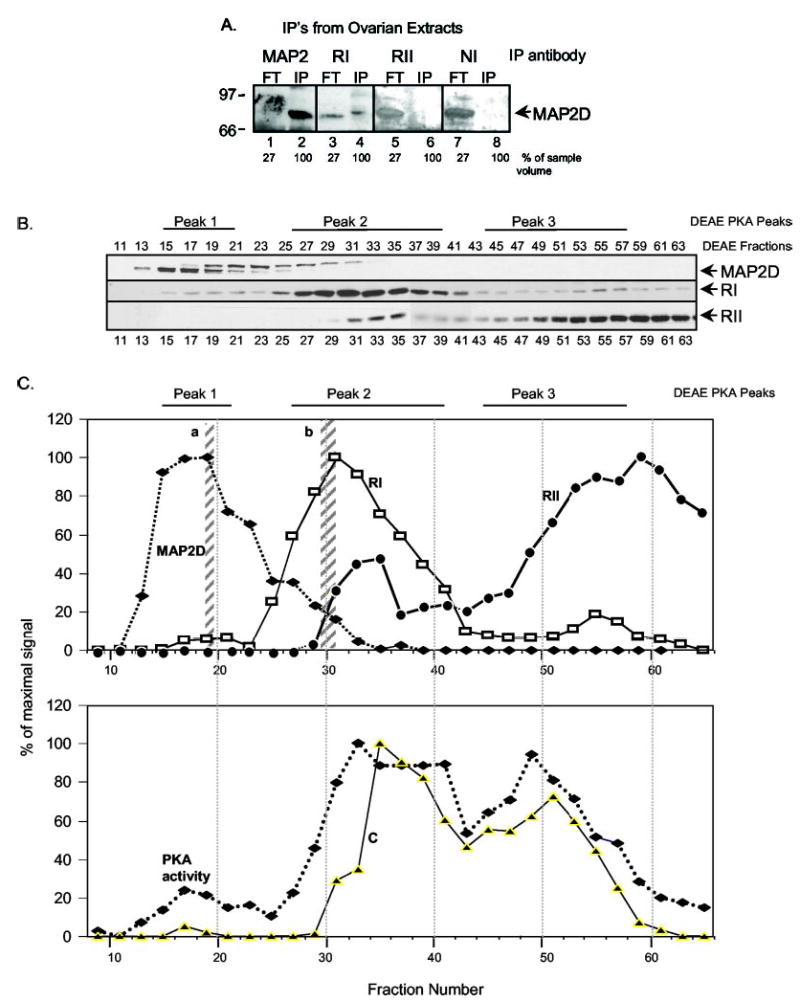
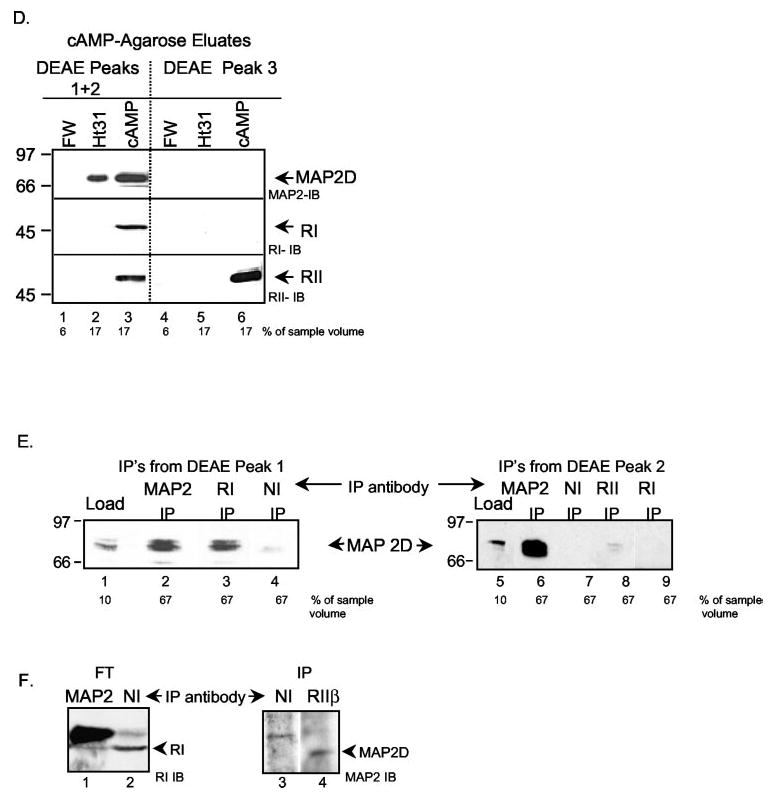
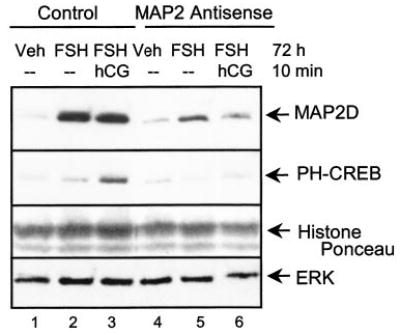
A-kinase anchoring proteins (AKAPs) function to target protein kinase A (PKA) to specific locations within the cell. AKAPs are functionally identified by their ability to bind the type II regulatory subunits (RII) of PKA in an in vitro overlay assay. We previously showed that follicle-stimulating hormone (FSH) induces the expression of an 80-kDa AKAP (AKAP 80) in ovarian granulosa cells as they mature from a preantral to a preovulatory phenotype. In this report, we identify AKAP 80 as microtubule-associated protein 2D (MAP2D), a low molecular weight splice variant of the neuronal MAP2 protein. MAP2D is induced in granulosa cells by dexamethasone and by FSH in a time-dependent manner that mimics that of AKAP 80, and immunoprecipitation of MAP2D depletes extracts of AKAP 80. MAP2D is the only MAP2 protein present in ovaries and is localized to granulosa cells of preovulatory follicles and to luteal cells. MAP2D is concentrated at the Golgi apparatus along with RI and RII and, based on coimmunoprecipitation results, appears to bind both RI and RII in granulosa cells. Reduced expression of MAP2D resulting from treatment of granulosa cells with antisense oligonucleotides to MAP2 inhibited the phosphorylation of cAMP-response element-binding protein. These results suggest that this classic neuronal RII AKAP is a dual RI/RII AKAP that performs unique functions in ovarian granulosa cells that contribute to the preovulatory phenotype.


Figures

Fig. 1
Fig. 1. Effect of FSH and dexam-ethasone on the expression of AKAP 80/MAP2D
Granulosa cells from estrogen-primed rats were treated for 72 h with vehicle (Veh), 50 ng/ml FSH, or 10 nM dexamethasone (DEX). Total cell extracts were subjected to either RII overlay assay (A) or immunoblotting (IB) using a mouse monoclonal MAP2 antibody at 1:1000 dilution (B). Ponceau S staining of the protein in B (lanes 1–3) is shown in lanes 5–7, respectively. Lane 4, molecular weight markers. See “Experimental Procedures” for details. Results are representative of two separate experiments.
Fig. 2
Fig. 2. In vitro expression of MAP2D
A, granulosa cells from estrogen-primed rats were treated with 50 ng/ml FSH for 0, 8, 24, 48, or 72 h. Total cell extracts were boiled in SDS-PAGE sample buffer and subjected to either RII overlay assay (top) or Western blotting using a mouse monoclonal MAP2 antibody (bottom). Lane 6, cells were harvested in buffer A, boiled for 10 min, and centrifuged at 10,000 × g for 10 min at 4 °C, and the supernatant fraction was loaded onto the gel. Results are representative of three separate experiments. B, detergent-soluble ovarian extracts from PMSG-treated rats (500 μg of protein) were subjected to immunoprecipitation using either the mouse monoclonal anti-MAP2 antibody (10 μl) or control NI mouse anti-HA antibody (10 μl) in the presence of protein A+G-agarose. The agarose pellets were washed in buffer D, and proteins were separated by SDS-PAGE, blotted to Immobilon, and subjected to an RII overlay assay as described under “Experimental Procedures.” Results are representative of two separate experiments. C, detergent-soluble ovarian extracts from PMSG-treated rats (800 μg of protein) were subjected to immunoprecipitation using either the mouse monoclonal anti-MAP2 antibody (10 μl) or control NI mouse anti-HA antibody (10 μl) in the presence of protein A+G-agarose in a total volume of 200 μl. The flow-through (FT) collected upon pelleting the agarose was boiled, and 50% was subjected to SDS-PAGE. P, washed agarose pellet. Following SDS-PAGE, proteins were subjected to an RII overlay assay. Results are representative of two separate experiments. D, cells were treated with 50 ng/ml FSH for either 0 or 48 h. Cells were harvested in 1 ml of Trizol® reagent, and RNA was isolated by phenol/chloroform extraction and isopropyl alcohol precipitation. 500 ng of RNA was DNase-treated and subjected to reverse transcriptase-PCR using the primers and conditions described under “Experimental Procedures.”
Fig. 3
Fig. 3. MAP2 isoform expression in rat ovary compared with brain
Rats were injected with vehicle (Veh) or 25 IU of PMSG, and ovaries were harvested 48 h later. For hCG treatment, rats were injected with 25 IU of hCG 48 h post-PMSG injection, and ovaries were obtained 1 h post-hCG. Brain tissue was collected 48 h post-PMSG injection. Soluble extracts were made by homogenizing ovaries or brain in buffer A and centrifugation (10 min, 10,000 × g, 4 °C). MAP2 was immunoprecipitated from soluble extracts (500 μg of protein in a total volume of 500 μl) as described under “Experimental Procedures.” Results are representative of three separate experiments.
Fig. 4
Fig. 4. Expression of MAP2D during ovarian differentiation
A, rats were not treated or were injected with either 25 IU of PMSG or with 25 IU of PMSG followed by 25 IU of hCG. Ovaries were harvested at the time points indicated after injections. Soluble extracts were made by homogenizing whole ovaries in buffer A, as described under “Experimental Procedures.” Equal concentrations of protein (60 μg) were loaded. Following SDS-PAGE and transfer, blots were subjected to RII overlay assay (top) or Western blotting using anti-MAP2D antibody or, as a loading control, anti-cyclin D2 antibody. Results are representative of two separate experiments. B, rats were injected with either 25 IU of PMSG or with 25 IU of PMSG followed by 25 IU of hCG. Ovaries were harvested 48 h post-PMSG or 48 h post-hCG into 4% paraformaldehyde. Ovarian tissue was sectioned onto glass slides and subjected to immunohistochemistry. -Fold magnification is indicated at the bottom. Results are representative of two separate experiments.
Fig. 5
Fig. 5. Phosphorylation of MAP2D in granulosa cells
A, PO granulosa cells obtained from rats 48 h after injection of 10 IU of PMSG were incubated overnight with 0.5 mCi of 32Pi to label cellular ATP pools. Granulosa cells were then treated for 10 min with vehicle or 1 IU/ml hCG. Cell extracts were prepared in buffer A and then subjected to immunoprecipitation with indicated antibodies, as detailed under “Experimental Procedures.” Following SDS-PAGE, gel was dried and exposed to film. Results are representative of three separate experiments. B, granulosa cells were treated with 50 ng/ml FSH for the times indicated, and total cell extracts were subjected to Western blotting with either MAP2 antibody or anti-phospho-MAP2 (antibody 305) or to RII overlay. Results are representative of two separate experiments.
Fig. 6
Fig. 6. DEAE-cellulose and cAMP-agarose affinity chromatography of PO ovarian extracts
A, detergent-soluble ovarian extracts (800 μg of protein in 300 μl) were prepared (without DTT), subjected to cross-linking by incubating with 1 mM DSP for 15 min at room temperature, and then subjected to immunoprecipitation using the indicated antibodies (anti-MAP2 (Sigma), anti-RI (BD Biosciences), and anti-RII (Upstate Biotechnology)). Flow-through (FT) represents 27% of the extract that was not pulled down by the antibody-agarose complex. IP, immunoprecipitated complex. Samples were subjected to SDS-PAGE and blotted with anti-MAP2 antibody. Results for RII and NI immunoprecipitations are overexposed to confirm the absence of signal in the immunoprecipitation complex lanes. Results are representative of three separate experiments. B, ovaries from 15 rats were harvested 48 h post-PMSG injection and homogenized in buffer E, and a soluble extract was prepared by centrifuging at 105,000 × g for 15 min and loading onto a DEAE-cellulose column. Proteins were eluted with a linear salt gradient, collecting fractions in buffer B but without DTT. Aliquots of odd-numbered fractions were mixed with SDS-PAGE sample buffer, boiled, and subjected to SDS-PAGE and Western blotting with the indicated antibodies. Results are representative of four separate experiments. C, a graphic representation of the Western data presented in B but now normalized to percentage of maximal signal. Also shown is the cAMP-stimulated PKA activity, also normalized to percentage of maximal signal (lower portion of C). In D, fractions from the indicated DEAE-cellulose peak fractions (shown in C) were pooled, concentrated, and incubated with cAMP agarose. The agarose was washed with low and high salt buffers to remove nonspecifically bound proteins, and the final wash (FW) was collected. Specifically bound AKAPs were eluted first with 5 μM Ht31 (Ht31) and then with 75 mM cAMP. The samples were mixed with SDS-PAGE sample buffer and boiled, and aliquots were then subjected to SDS-PAGE and Western blotting using the antibodies indicated. Results are representative of four separate experiments. E, fractions from indicated regions of the DEAE-cellulose column (shown in C) were pooled, 1-ml aliquots were incubated with the protein cross-linker (DSP; 1 μM) for 15 min at room temperature, and samples were subjected to immunoprecipitation with the indicated antibodies (see A). A 100-μl aliquot of the 1-ml starting material was boiled and applied to the gel (Load). Agarose pellets were washed with buffer D, and proteins were eluted from the protein A+G-agarose with 150 μl of Immunopure® elution buffer, pH 2.8, mixed with SDS-PAGE sample buffer, and boiled. 67% of the total eluate (IP) was loaded onto the gel for SDS-PAGE. Results are representative of two separate experiments. F, immunoprecipitations from pooled and concentrated DEAE peak 1 and 2 fractions (lanes 1 and ) or from PKA IIβ holoenzyme in these fractions that was sedimented by sucrose density gradient centrifugation (lanes 3 and ) were conducted with Sigma anti-MAP2 antibody, anti-HA (NI), or BD Biosciences anti-RIIβ antibodies. Lanes 1 and 2, immunodepletion results for proteins that were not imunoprecipitated. Lanes 3 and 4, immunoprecipitation results. Results are representative of two independent experiments.
Fig. 7
Fig. 7. Cellular location of MAP2D
Cells were plated on glass coverslips coated with fibronectin and treated for 72 h with vehicle (Veh) or 50 ng/ml FSH, as indicated. The cells were fixed in 4% paraformaldehyde plus Triton X-100, blocked in 1% bovine serum albumin, and incubated with the indicated primary antibodies overnight at 4 °C at a dilution of 1:200, with the exception of anti-PKA RII and MAP2 in B, in which primary antibodies were at a 1:1000 dilution. Secondary antibodies were added at a dilution of 1:100, with the exception of those for anti-PKA RII and MAP2 in B, in which secondary antibodies were at a 1:200 dilution. Slides were analyzed by confocal microscopy using a Zeiss LSM510 laser-scanning microscope. A phase-contrast image of the cells is also shown. No fluorescent signal was detected in the presence of primary or secondary antibodies alone. Primary and corresponding secondary antibodies used were as follows. A, mouse anti-MAP2 (Sigma) and goat anti-mouse rhodamine; B, e–h, rabbit anti-RI (82) and goat anti-rabbit fluorescein, mouse anti-MAP2, and goat anti-mouse rhodamine; i–l, goat anti-RII (Upstate Biotechnology) and donkey anti-goat rhodamine, mouse anti-MAP2 (Sigma), and donkey anti-mouse fluorescein; C, m–p, mouse anti-MAP2, goat anti-mouse fluorescein, and actin phalloidin; q–t, mouse anti-γ-tubulin (Sigma) and goat anti-mouse fluorescein, rabbit anti-RI, and goat anti-rabbit rhodamine; D, mouse anti-Gm 130 conjugated to fluorescein, mouse anti-MAP2, and goat anti-mouse rhodamine. D, cells were treated for 72 h with FSH and then for 1 h with 10 μM brefeldin A and fixed as described above. Results are representative of at least three separate experiments.
Fig. 8
Fig. 8. Effect of reduced MAP2D expression on LH receptor signaling to CREB
Granulosa cells from estrogen-primed rats were plated on tissue culture plates coated with 100 ng/ml poly-L-lysine and treated with vehicle (Veh) or FSH for 72 h or with FSH for 72 h followed by 1 IU/ml hCG (hCG) for 10 min in the presence of either scrambled (Control) or antisense (Antisense) oligonucleotides against MAP2 as described under “Experimental Procedures.” Oligonucleotides were added at a concentration of 10 μg/ml every 12 h during the 72-h incubation period. Cells were harvested in SDS-PAGE sample buffer and subjected to Western blotting with antibodies against MAP2 (A, top) or phospho-CREB (PH-CREB) (middle). Protein load was determined using an antibody that detects total ERK and by Ponceau S staining (bottom). Results are representative of two independent experiments.

Similar articles

Cited by

References

    1. McGee EA, Hsueh AJ. Endocr Rev. 2000;21:200 –214. - PubMed
    1. Richards JS. Physiol Rev. 1980;60:51–89. - PubMed
    1. Robinson-White A, Stratakis CA. Ann N Y Acad Sci. 2002;968:256 –270. - PubMed
    1. Taylor SS. J Biol Chem. 1989;264:8443–8446. - PubMed
    1. Dell’Acqua ML, Scott JD. J Biol Chem. 1997;272:12881–12884. - PubMed

Publication types

MeSH terms