. 2004 Aug;92(2):1116-32.
doi: 10.1152/jn.00529.2003. Epub 2004 Mar 31.

Potassium model for slow (2-3 Hz) in vivo neocortical paroxysmal oscillations

Affiliations

Potassium model for slow (2-3 Hz) in vivo neocortical paroxysmal oscillations

M Bazhenov et al. J Neurophysiol. 2004 Aug.

Abstract

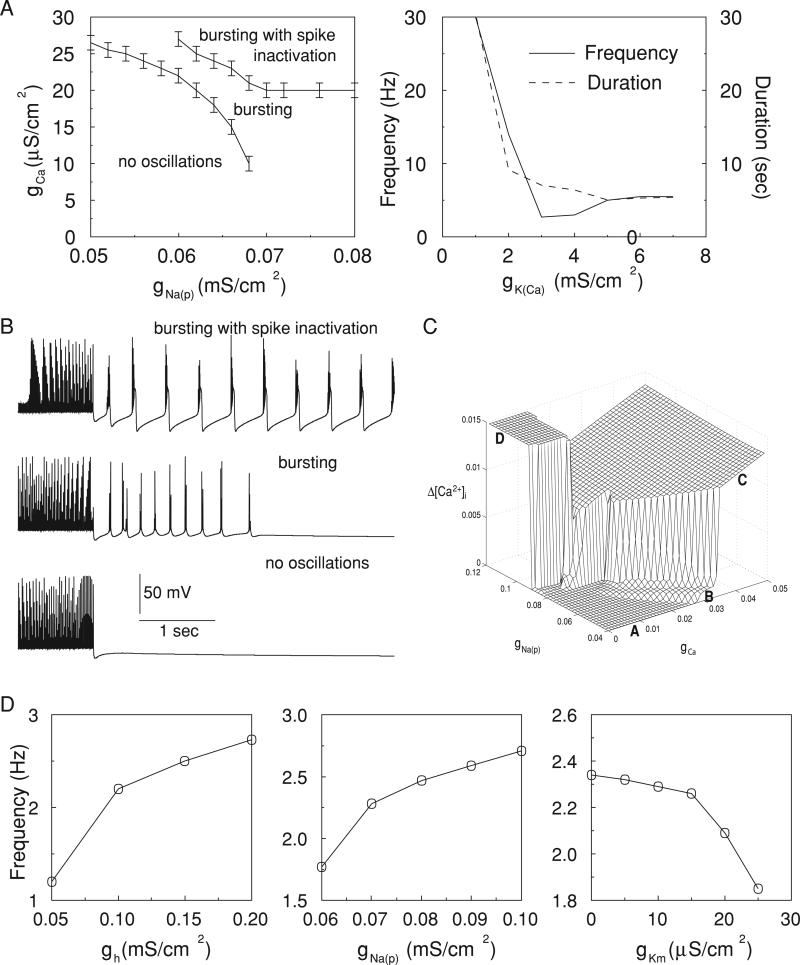
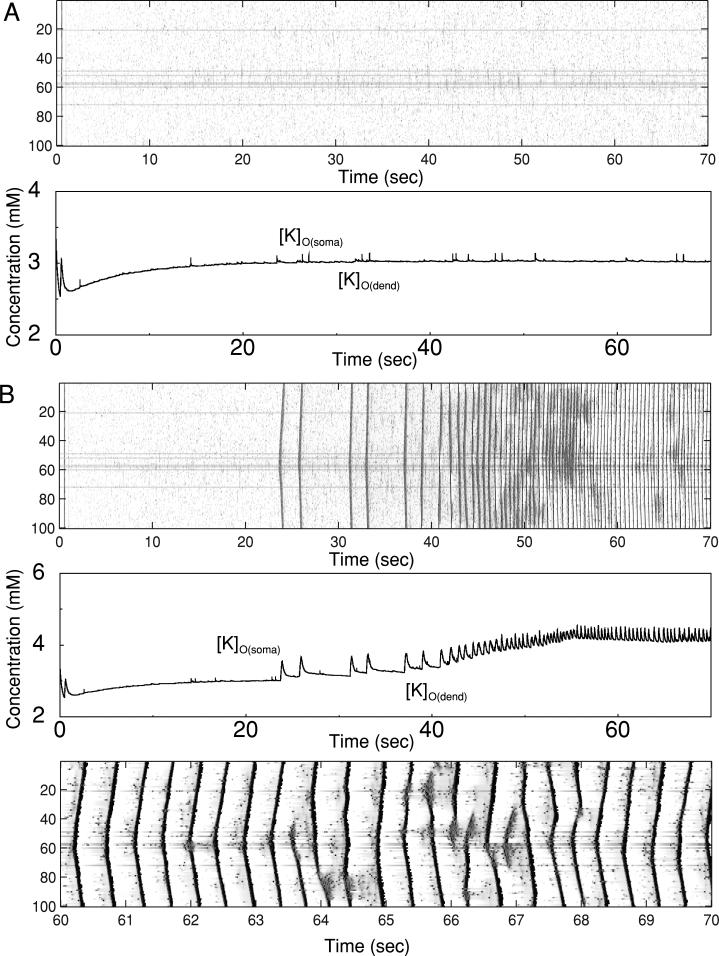
In slow neocortical paroxysmal oscillations, the de- and hyperpolarizing envelopes in neocortical neurons are large compared with slow sleep oscillations. Increased local synchrony of membrane potential oscillations during seizure is reflected in larger electroencephalographic oscillations and the appearance of spike- or polyspike-wave complex recruitment at 2- to 3-Hz frequencies. The oscillatory mechanisms underlying this paroxysmal activity were investigated in computational models of cortical networks. The extracellular K(+) concentration ([K(+)](o)) was continuously computed based on neuronal K(+) currents and K(+) pumps as well as glial buffering. An increase of [K(+)](o) triggered a transition from normal awake-like oscillations to 2- to 3-Hz seizure-like activity. In this mode, the cells fired periodic bursts and nearby neurons oscillated highly synchronously; in some cells depolarization led to spike inactivation lasting 50-100 ms. A [K(+)](o) increase, sufficient to produce oscillations could result from excessive firing (e.g., induced by external stimulation) or inability of K(+) regulatory system (e.g., when glial buffering was blocked). A combination of currents including high-threshold Ca(2+), persistent Na(+) and hyperpolarization-activated depolarizing (I(h)) currents was sufficient to maintain 2- to 3-Hz activity. In a network model that included lateral K(+) diffusion between cells, increase of [K(+)](o) in a small region was generally sufficient to maintain paroxysmal oscillations in the whole network. Slow changes of [K(+)](o) modulated the frequency of bursting and, in some case, led to fast oscillations in the 10- to 15-Hz frequency range, similar to the fast runs observed during seizures in vivo. These results suggest that modifications of the intrinsic currents mediated by increase of [K(+)](o) can explain the range of neocortical paroxysmal oscillations in vivo.


Figures

FIG. 1
FIG. 1
Progressively increased neuronal firing at the onset of seizures and decreased firing toward the end of seizures. Top: simultaneous field potential and intracellular recordings as well as firing rates obtained from simultaneous multiunit recordings from different cortical depths and averaged firing rates. Seizures are indicated by gray rectangulars. The vertical distance between tips of recording tungsten electrodes was ~400 μm. The depth of intracellularly recorded neuron estimated from micromanipulator reading was 650 μm. Bottom left: 1 seizure from top expanded in which examples of multiunit recordings are shown. One spike-wave complex from this seizure is further expanded (right).
FIG. 2
FIG. 2
Silent and active states of a single neuron. A: Poisson distributed random input depolarized single pyramidal (PY) cell that fired randomly. Extracellular K+ concentration ([K+]o) fluctuated ~2.5–3 mM and concentration of K+ bound to the buffer ([KB]) stabilized at ~25 mM. B: silent state with no external stimulation.
FIG. 3
FIG. 3
Periodic activity induced by a current pulse. A: DC pulse (10 s in duration) was applied to the silent cell. After high-frequency firing, [K+]o increased and maintained periodic 2- to 3-Hz oscillations in PY neuron lasted about 10 s after DC pulse was removed. B: time evolution of ionic conductances. C: when [K+]o was increased around somatic (left) or dendritic (right) compartment only, low-frequency oscillations were absent. D: the same stimulus applied to interneuron (IN) was not followed by periodic bursting. E: including K+ diffusion between dendrites and soma eliminated difference in [K+]o levels between compartments, but the neuron response patterns remained largely unchanged.
FIG. 4
FIG. 4
Effect of [K+]o increase on neuron oscillations. A: bifurcation diagram (stable attractors) shows steady-state voltage for nonoscillatory regime ([K+]o < 4.3 mM) and the maximum and minimal voltage for periodic solutions ([K+]o > 4.3 mM). B: [Ca2+]i on the secant Vm = 0 for different levels of [K+]o. Appearance of the upper branch at [K+]o > 4.95 mM indicates regimes with spike inactivation. Inset: interval 4.5 mM < [K+]o < 5 mM. C: examples of oscillatory regimes corresponding to [K+]o values marked by numbers 1 ([K+]o = 3.5 mM), 2 ([K+]o = 4.5 mM), 3 ([K+]o = 4.9 mM), 4 ([K+]o = 6 mM), 5 ([K+]o = 10 mM), and 6 ([K+]o = 14 mM) in A and B. D: phase portraits Vm([Ca2+]i) for oscillatory regimes shown above.
FIG. 5
FIG. 5
Oscillations induced by [K+]o injection. [K+]o increase both around dendrites and soma was required to maintain 2- to 3-Hz activity. A–D: when [K+]o around soma was set to ~5.5 mM, 5.5– 8 mM range of [K+]o in the dendrites was required to initiate oscillations. E: insufficient increase of [K+]o around soma prevented self-sustained oscillations. F: periodic 2- to 3-Hz bursting with spike inactivation (see, e.g., B) was observed in the large region including [K+]o(soma) = [K+]o(dend) line (- - -).
FIG. 6
FIG. 6
Effect of intrinsic conductances on neuron oscillations. A: increase of [K+]o during DC stimulation led to oscillations. Sufficiently high levels of persistent Na+ and high-threshold Ca2+ conductances were required to maintain periodic bursting (top left). Increase of Ca2+-dependent K+ current reduced both duration and frequency of oscillations (top right). B: examples of PY oscillations corresponding to different regimes indicated in A, left. C: [Ca2+]i increase during a burst as a function of parameters gNa(p) and gCa for a cell hold at a constant level of [K+]o (5.5 mM). Longer bursts (more spikes or spike inactivation) produced higher [Ca2+]i change. Four different regions can be selected: A, no oscillations; B, bursting; C, bursting with spike inactivation; D, membrane potential “lock” in depolarized state. D: effect of the intrinsic conductances on frequency of oscillations. The most significant frequency changes (1–3 Hz) occurred with variations of the Ih maximal conductance.
FIG. 7
FIG. 7
Effect of glial buffering and K+ pump on a neuron activity. A: blocking glial uptake system transformed “normal” random firing maintained by random external stimulation into periodic bursting and eventually led to permanent spike inactivation. B: after block of K+ pump, [K+]o increased and led to fast bursting.
FIG. 8
FIG. 8
Network oscillations following DC stimulation. A group of cells (numbers 30–50) was stimulated by DC pulse that induced high-frequency firing. A: after stimulus termination (at t = 38 s), the oscillations lasted continuously. B: when lateral (between cells) diffusion of K+ was introduced, oscillations were terminated ~15 s after stimulus termination. K+ diffusion between compartments maintained identical levels of [K+]o around soma and around dendrites. Bottom: [K+]o evolution for neurons 5 and 35 is shown. C: oscillation in a larger network with 300 PY and 75 IN neurons. Connections fan out was ±15 cells for AMPA and NMDA mediated PY-PY synapses; ±3 cell for AMPA- and N-methyl-d-aspartate (NMDA)-mediated PY-IN synapses; ±15 cells for GABAA mediated IN-PY synapses.
FIG. 9
FIG. 9
Effect of IN-mediated inhibition. Random network activity was maintained by Poisson distributed inputs to PY cells and INs. A: in control conditions, the network fired randomly with [K+]o stabilized at relatively low level. B: when GABAA conductance was blocked at t = 5 s, increased firing led to the grow of [K+]o and bursting. [K+]o evolution for neuron 35 is shown.
FIG. 10
FIG. 10
Effect of K+ pump on network activity. Blocking the K+ pump at t = 5 s led to increase of [K+]o and bursting. Oscillations continued after removing random external input at t = 50 s. A group of cell with Ih led the network oscillations.
FIG. 11
FIG. 11
Effect of glial buffering on network activity. Glial buffering system was blocked in a group of cells (numbers 30–50) at t = 5 s. A: low-frequency bursting was found in this group and was followed by permanent spike inactivation at about t = 20 s. B: when lateral (between cell) diffusion of K+ was introduced to the model, the cells outside the group also increased firing. After external random input to the network was removed at t = 50 s, the network displayed periodic oscillations at ~3 Hz.

Similar articles

Cited by

References

    1. Abbott LF, Varela JA, Sen K, Nelson SB. Synaptic depression and cortical gain control. Science. 1997;275:220–224. - PubMed
    1. Alzheimer C, Schwindt PC, Crill WE. Modal gating of Na+ channels as a mechanism of persistent Na+ current in pyramidal neurons from rat and cat sensorimotor cortex. J Neurosci. 1993;13:660–673. - PMC - PubMed
    1. Amzica F, Massimini M, Manfridi A. Spatial buffering during slow and paroxysmal sleep oscillations in cortical networks of glial cells in vivo. J Neurosci. 2002;22:1042–1053. - PMC - PubMed
    1. Bazhenov M, Timofeev I, Steriade M, Sejnowski TJ. Cellular and network models for intrathalamic augmenting responses during 10-Hz stimulation. J Neurophysiol. 1998;79:2730–2748. - PubMed
    1. Bazhenov M, Timofeev I, Steriade M, Sejnowski TJ. Model of thalamocortical slow-wave sleep oscillations and transitions to activated states. J Neurosci. 2002;22:8691–8704. - PMC - PubMed

Publication types