Comparative Study
. 2004 Mar 31;24(13):3152-63.
doi: 10.1523/JNEUROSCI.5589-03.2004.

Parallel FoxP1 and FoxP2 expression in songbird and human brain predicts functional interaction

Affiliations
Comparative Study

Parallel FoxP1 and FoxP2 expression in songbird and human brain predicts functional interaction

Ikuko Teramitsu et al. J Neurosci. .

Abstract

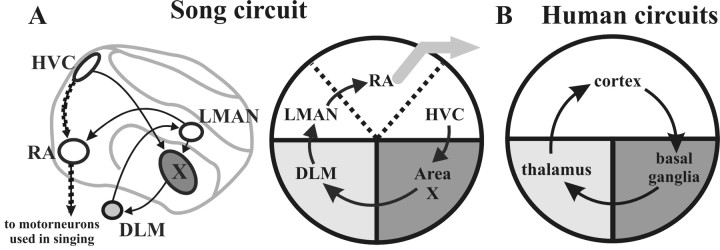
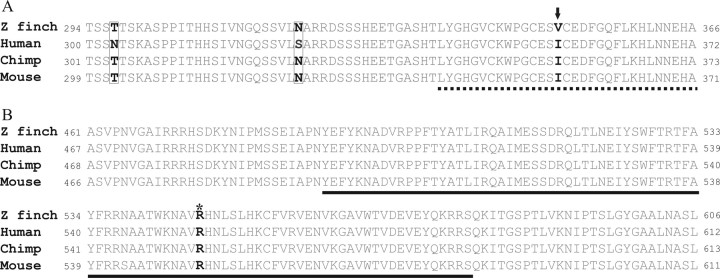
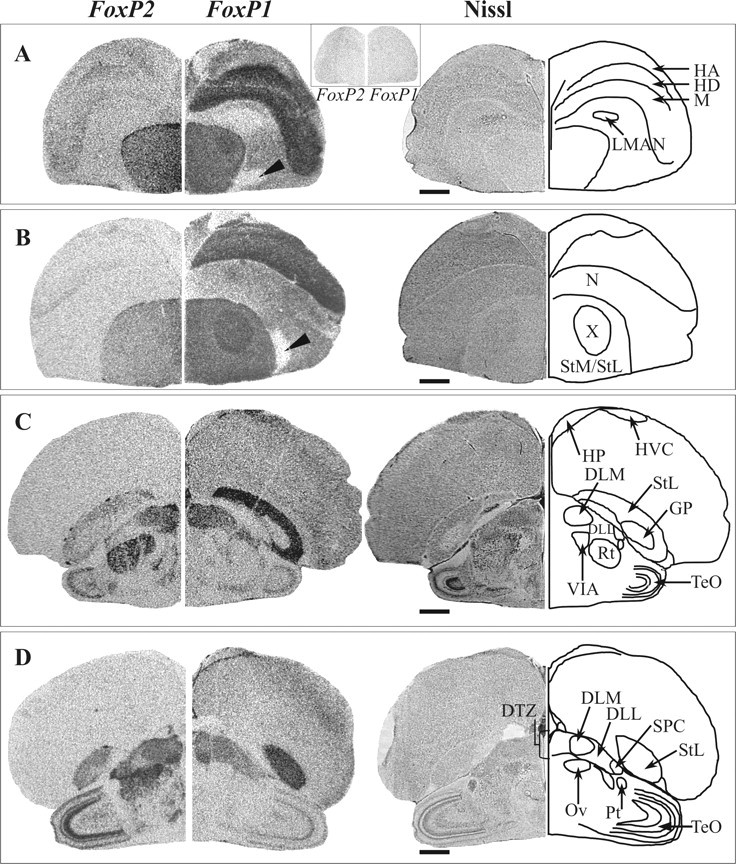
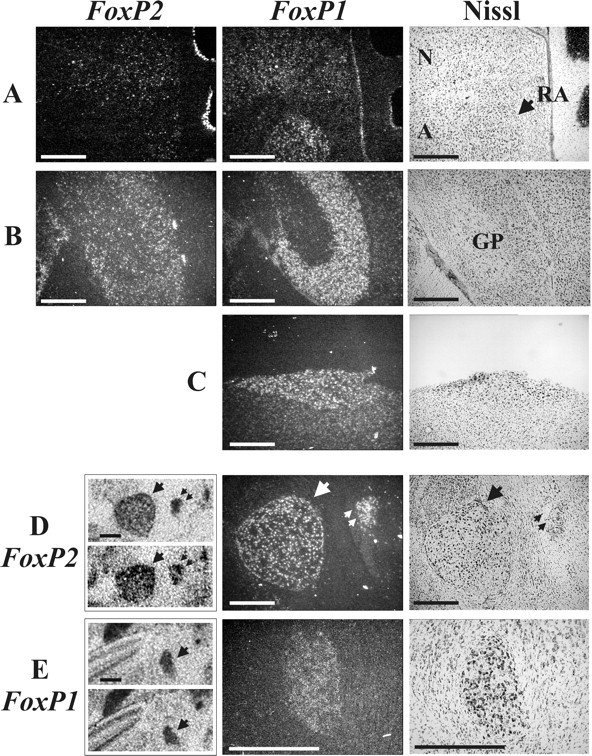
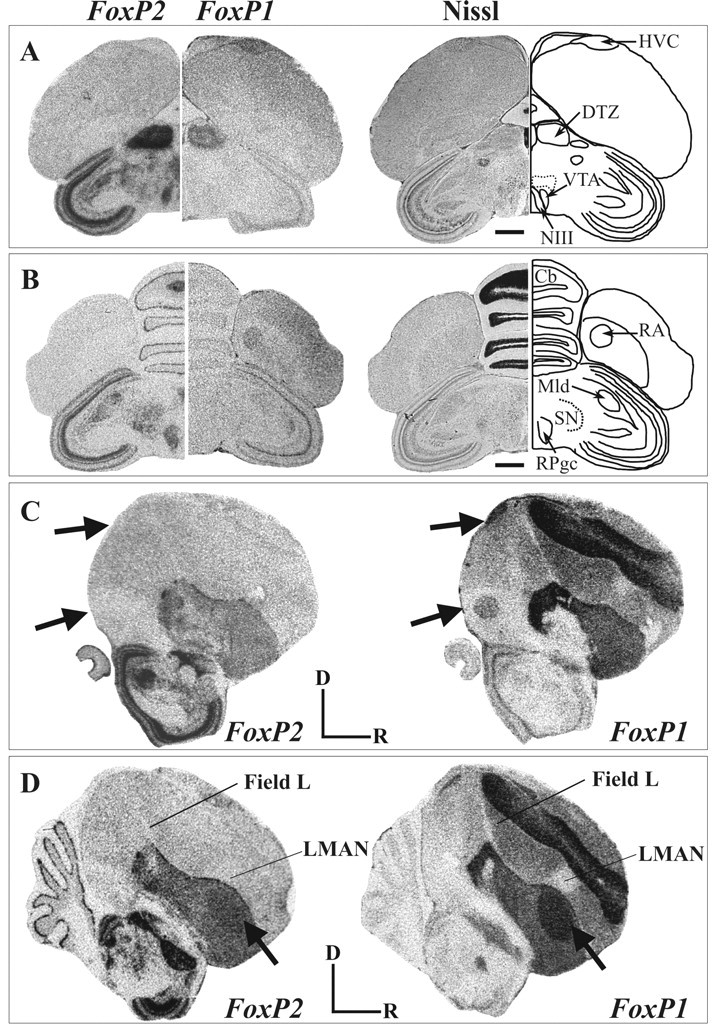
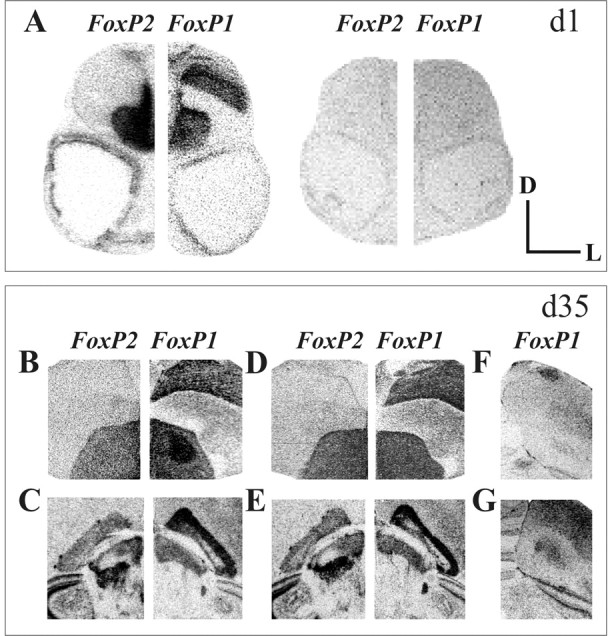
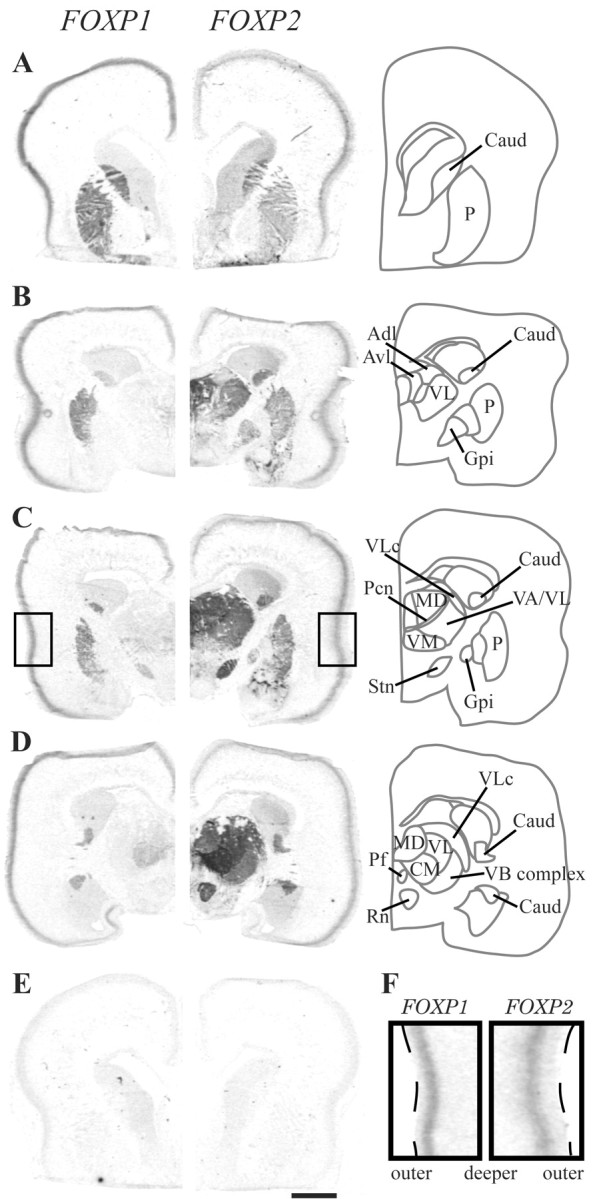
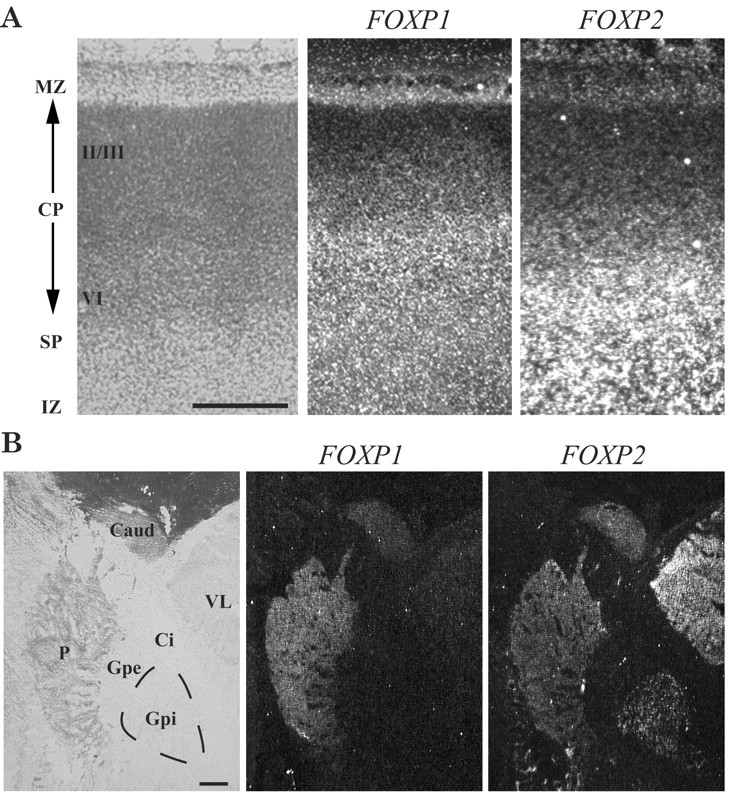
Humans and songbirds are two of the rare animal groups that modify their innate vocalizations. The identification of FOXP2 as the monogenetic locus of a human speech disorder exhibited by members of the family referred to as KE enables the first examination of whether molecular mechanisms for vocal learning are shared between humans and songbirds. Here, in situ hybridization analyses for FoxP1 and FoxP2 in a songbird reveal a corticostriatal expression pattern congruent with the abnormalities in brain structures of affected KE family members. The overlap in FoxP1 and FoxP2 expression observed in the songbird suggests that combinatorial regulation by these molecules during neural development and within vocal control structures may occur. In support of this idea, we find that FOXP1 and FOXP2 expression patterns in human fetal brain are strikingly similar to those in the songbird, including localization to subcortical structures that function in sensorimotor integration and the control of skilled, coordinated movement. The specific colocalization of FoxP1 and FoxP2 found in several structures in the bird and human brain predicts that mutations in FOXP1 could also be related to speech disorders.


Figures

Figure 1.
Figure 1.
Schematic views of the avian song circuit and human cortico-basal ganglia-thalamo-cortical circuitry. The cortex is white, basal ganglia dark gray, and thalamus is light gray. A, Left, Composite sagittal view of songbird telencephalon. Auditory input (not shown) enters the song circuit at the HVC, the neurons of which contribute to two pathways. The vocal motor pathway (stippled arrows) controls song production and is composed, sequentially, of the hyperpallial nucleus HVC, the arcopallial nucleus RA, and brainstem motor neurons that innervate the song organ and respiratory muscles (data not shown) (Nottebohm et al., 1976; Wild, 1993). The anterior forebrain pathway APF; (plain arrows), which allows song modification (Bottjer et al., 1984; Scharff and Nottebohm, 1991; Williams and Mehta, 1999; Brainard and Doupe, 2000), begins with a subset of HVC neurons that project to area X in the striatum (Mooney, 2000). The pathway proceeds through the DLM in the thalamus, back to the pallial nucleus LMAN. Projections of LMAN neurons join the two pathways at RA (Nottebohm et al., 1982; Okuhata and Saito, 1987; Bottjer et al., 1989; Mooney and Konishi, 1991), and these same LMAN neurons send axon collaterals back to area X (Vates and Nottebohm, 1995). Middle, Schematic focuses on the AFP, a cortico-striato-thalamo-cortical circuit. In this simplified scheme, LMAN to area X connections, among others, are not shown. The gray arrow indicates telencephalic output onto motor neurons. B, Schematic of human cortico-basal ganglia-thalamo-cortical circuitry for comparison.
Figure 2.
Figure 2.
Alignment of deduced amino acid sequences from the zebra finch FoxP2 cDNA (GenBank accession number AY395709) with three mammalian sequences (accession numbers: AF337817, human; AF512947, chimpanzee; AF339106, mouse). A, The selected region includes the positions at which two residues in the human sequence (boxes; N303 and S325) differ from other primates (Enard et al., 2002). The putative zinc finger domain (dotted underscore) is also shown. In the zebra finch, a conservative substitution of valine for isoleucine at position 350 (arrow; I350V) occurs within this domain. Four additional zebra finch substitutions (S42T, S78G, S229N, and A243S; data not shown) occur at positions outside of the currently identified protein domains.B, Selected region spans the Fox domain (solid underscore) that shows 100% identity between finch, human, and chimp. The asterisk indicates an invariant arginine at position 553 in humans that is mutated to histidine in a rare speech and language disorder (Lai et al., 2001).
Figure 3.
Figure 3.
Representative bright-field photomicrographs of a series of coronal sections with areas of FoxP1 and FoxP2 mRNA expression from film in adult male zebra finch brain are shown next to corresponding Nissl-stained sections. Schematic drawings of the Nissl stains highlight areas of expression. (see Materials and Methods for the specificity and the anatomical designation of mRNA expression patterns). A–D, Side-by-side comparisons of FoxP1 (right) and FoxP2 (left) reveal cortical, striatal, and thalamic regions with distinct, as well as overlapping, expression of the two genes. The inset in A shows adjacent sections hybridized with corresponding sense probes. Note strong FoxP1 expression within area X in B and within HVC in C, two song nuclei. The arrowheads in A point to the region of Bas. Locations of sections in A–D correspond to the level of plates 3, 5, 17–18, and 19 in the canary atlas of Stokes et al. (1974), respectively. C, D, FoxP1 and FoxP2 are additionally expressed in subtelencephalic motor and sensory processing structures. Scale bars, 1 mm.
Figure 4.
Figure 4.
Representative magnified photomicrographs of selected regions of adult male zebra finch brain. In A–C, emulsion-dipped material is shown next to the corresponding Nissl-stained section. A, FoxP2 signals are higher in the nidopallium (N) than in the arcopallium (A). The song nucleus RA, apparent in the Nissl stain (arrow), expresses FoxP1 signal but lacks FoxP2 signal. B, Images of the GP, recognizable in the Nissl-stained section, reveal the lack of FoxP1 and diffuse FoxP2 signals. C, The enhanced FoxP1 signal observed in the HVC with film autoradiography in Figures 3C and 5, A and C, is confirmed with emulsion auotradiography and Nissl stain. D, E, Examples of subtelencephalic regions that express FoxP2 (small arrows, nucleus Ov; large arrow, nucleus Rt) and FoxP1 (nucleus SpL), respectively. In the left panels, film autoradiograms show the specificity of these expression patterns, confirmed by the use of two non-overlapping probes. In each, the top image corresponds to the first probe, and bottom to the second probe (see Materials and Methods). Remaining images are a higher magnification of the aforementioned structures shown with emulsion autoradiography (middle) and Nissl stain (right). Scale bars, 1 mm.
Figure 5.
Figure 5.
Representative bright-field photomicrographs of coronal (A, B) or sagittal (C, D) sections highlight (arrows) the enhanced expression of FoxP1 mRNA in song nuclei of adult male zebra finch brain, whereas no such enhancement is evident for FoxP2. A, B, Coronal images on the left half of the figure are of FoxP2 (far left) and FoxP1 expression patterns. On the right half of the figure, adjacent Nissl-stained sections and schematic drawings (far right) of these stains highlight enhanced areas of expression. Scale bars, 1 mm. A, The premotor song nucleus HVC exhibits strong FoxP1 expression. FoxP2, in contrast, is only moderately expressed in the HVC at the level comparable with the surrounding nidopallium. B, C, The arcopallium, including RA, lacks FoxP2 signal. In contrast, FoxP1 is expressed in RA. D, The striatal song nucleus, area X, exhibits enhanced expression of FoxP1 while expressing FoxP2 at a level comparable with or slightly higher than the surrounding area. Both field L and LMAN appear to lack FoxP signals. Note that the cerebellar expression of FoxP2 appears confined to Purkinje cells. The 5 mm scale bar represents dorsal (D) and rostral (R).
Figure 6.
Figure 6.
Representative bright-field photomicrographs of developing zebra finch brains. Coronal sections demonstrate that the general expression patterns observed in adult brains for FoxP1 (right) and FoxP2 (left) mRNA are evident in younger animals. A, Bright-field images of sections through the head of d1 birds exhibit substantial FoxP1 expression in pallial regions and in the striatum. FoxP2 expression overlaps with that of FoxP1 in the striatum. Sections on the right were hybridized with the corresponding sense probes. B, C, F, In d35 male birds, characteristic expression patterns of FoxP1 and FoxP2 are already evident, including enhanced expression of FoxP1 in the song nucleus, area X (B), and HVC (F). D, E, G, Images from d35 females reveal the sexually dimorphic expression of FoxP1, whereas FoxP2 lacks such dimorphism. Note the lack of enhanced expression of FoxP1 in the striatum, where area X exists in males (compare B, D, right). The smaller female RA expresses FoxP1 (G) (see Fig. 5B for a comparison to adult male RA).
Figure 7.
Figure 7.
Representative bright-field photomicrographs of a series of coronal sections show regions of FOXP1 and FOXP2 mRNA expression in brains from 19 week (A, E) and 22 week (B–D) fetuses. Schematic figures based on Nissl-stained sections correspond to the adjacent photomicrographs on the right and highlight areas in which the FOXP genes are expressed. A–D, Side-by-side comparisons of FOXP1 (left) and FOXP2 (right) reveal nucleus caudatus and putamen with overlapping expressions of the two genes. B–D, FOXP2 is expressed in thalamic structures of the somatic motor system. E, Sense probes for FOXP1 and FOXP2 present no significant signals. Scale bar: A–F, 5 mm. Magnification of the boxed areas in C shows FOXP1 expression in the outer layers of the cortex and FOXP2 expression in the deeper cortical layers.
Figure 8.
Figure 8.
Dark-field images from emulsion autoradiography (right) alongside corresponding bright-field images of Nissl-stained sections (left). A, FOXP1 shows expression in the cortical plate ranging from layers II/III and deeper. FOXP2 shows pronounced expression in layer VI and the subplate and the intermediate zone. B, FOXP2 has expression in the GPi, where silver grains are absent for FOXP1 expression. FOXP2 also shows stronger expression in VL than FOXP1. Scale bars: A, 0.5 mm. B, 1 mm.

Similar articles

Cited by

References

    1. Akutagawa E, Konishi M (2001) A monoclonal antibody specific to a song system nuclear antigen in estrildine finches. Neuron 31: 545–556. - PubMed
    1. Alcock KJ, Passingham RE, Watkins KE, Vargha-Khadem F (2000a) Oral dyspraxia in inherited speech and language impairment and acquired dysphasia. Brain Lang 75: 17–33. - PubMed
    1. Alcock KJ, Passingham RE, Watkins K, Vargha-Khadem F (2000b) Pitch and timing abilities in inherited speech and language impairment. Brain Lang 75: 34–46. - PubMed
    1. Belton E, Salmond CH, Watkins KE, Vargha-Khadem F, Gadian DG (2003) Bilateral brain abnormalities associated with dominantly inherited verbal and orofacial dyspraxia. Hum Brain Mapp 18: 194–200. - PMC - PubMed
    1. Bottjer SW, Johnson F (1997) Circuits, hormones, and learning: vocal behavior in songbirds. J Neurobiol 33: 602–618. - PubMed

Publication types

MeSH terms

LinkOut - more resources