. 2004 Mar 31;24(13):3335-43.
doi: 10.1523/JNEUROSCI.5156-03.2004.

Differential distribution and function of hyperpolarization-activated channels in sensory neurons and mechanosensitive fibers

Affiliations

Differential distribution and function of hyperpolarization-activated channels in sensory neurons and mechanosensitive fibers

Thanh N Doan et al. J Neurosci. .

Abstract

Sensory neurons express hyperpolarization-activated currents (I(H)) that differ in magnitude and kinetics within the populations. We investigated the structural basis for these differences and explored the functional role of the I(H) channels in sensory neurons isolated from rat nodose ganglia. Immunohistochemical studies demonstrated a differential distribution of hyperpolarization-activated cyclic nucleotide-gated (HCN) protein (HCN1, HCN2, HCN4) in sensory neurons and peripheral terminals. HCN2 and HCN4 immunoreactivity was present in all nodose neurons. In contrast, only 20% of the total population expressed HCN1 immunoreactivity. HCN1 did not colocalize with IB4 (a marker for C-type neurons), and only 15% of HCN1-positive neurons colocalized with immunoreactivity for the vanilloid receptor VR1, another protein associated primarily with C-type neurons. Therefore, most HCN1-containing neurons were A-type neurons. In further support, HCN1 was present in the mechanosensitive terminals of myelinated but not unmyelinated sensory fibers, whereas HCN2 and HCN4 were present in receptor terminals of both myelinated and unmyelinated fibers. In voltage-clamp studies, cell permeant cAMP analogs shifted the activation curve for I(H) to depolarized potentials in C-type neurons but not A-type neurons. In current-clamp recording, CsCl, which inhibits only I(H) in nodose neurons, hyperpolarized the resting membrane potential from -63 +/- 1 to -73 +/- 2 mV and nearly doubled the input resistance from 1.3 to 2.2 GOmega. In addition, action potentials were initiated at lower depolarizing current injections in the presence of CsCl. At the sensory receptor terminal, CsCl decreased the threshold pressure for initiation of mechanoreceptor discharge. Therefore, elimination of the I(H) increases excitability of both the soma and the peripheral sensory terminals.


Figures

Figure 1.
Figure 1.
HCN1, HCN2, HCN3, and HCN4 mRNA is expressed in nodose ganglia. PCR products resulting from the amplification of first-strand cDNA prepared with (+) or without (–) RT from nodose ganglia or brain poly A+ RNA with HCN1-, HCN2-, HCN3-, and HCN4-specific oligonucleotides were separated by electrophoresis and transferred to nylon membranes (Ambion). After Southern hybridization with 32P-labeled specific internal oligomers, the autoradiogram showed a positive signal for all four channels from nodose and rat brain in the (+) RT lanes and no signals in the control (–) RT. The oligonucleotide probes amplify cDNA of 641 bp for HCN1, 638 bp for HCN2, 509 bp for HCN3, and 635 bp for HCN4.
Figure 2.
Figure 2.
HCN1, HCN2, and HCN4 immunoreactivity in nodose neurons. A–C, HCN immunoreactivity identified in 6–10 μm sections of nodose ganglion. HCN1 immunoreactivity was localized to a small subpopulation of neurons and, in most of these cells, was heavily localized at the plasma membrane (A). HCN2 (B) and HCN4 (C) immunoreactivity was present in all neurons in the ganglion. D–F, Single confocal sections through cultured nodose neurons selected for expression of HCN1 (D), HCN2 (E), and HCN4 (F). Heavy labeling at the membrane is again shown for HCN1 (D). Patches of HCN2 and HCN4 immunoreactivity were located at the cell perimeter; examples are indicated by the arrows (E, F). The light microscopic differential interference contrast image is also shown for each neuron. The calibration bar in C also applies to A and B, whereas calibration in F applies to E. The antibodies were preabsorbed with the immunizing peptide as shown in the figure. A control for nonspecific staining omitted the primary Ab (data not shown).
Figure 3.
Figure 3.
Colocalization of HCN1 and IB4 or VR1. A, No dose ganglion section immunolabeled with rabbit HCN1 Ab (left) and IB4 lectin (right). HCN1 neurons do not contain IB4. Three of the HCN1-labeled neurons are identified by an asterisk. B, Nodose section labeled with anti-HCN1 Ab (left) and anti-VR1 Ab (center) is shown overlaid on the right. The neurons with strong labeling for HCN1 did not coexpress VR1, but weaker HCN1 staining is seen on two VR1(*)-immunoreactive neurons. The arrow indicates an example of HCN1 axonal labeling.
Figure 4.
Figure 4.
Whole-cell voltage-clamp recordings of IH in isolated nodose neurons. A–C, Representative current traces of IH measured in physiological saline (A), 30 sec after addition of 5 mm CsCl (B), or after washout of CsCl (C) (n = 15). D–F, Representative current traces of IH in a different neuron in the absence (D) and presence (E, F) of 100μm ZD7288 (n = 14) for the time indicated. The intracellular pipette contained high potassium–aspartate solution. The neurons were held at –40 mV and pulsed in 10 mV step increments to potentials between –40 and –130 mV for 1 sec (A–C) or between –50 and –120 mV for 850 msec (D–F) followed by a step to –80 mV before returning to holding potential.
Figure 5.
Figure 5.
CsCl did not affect outward potassium currents in isolated no dose sensory neurons. A, Representative whole-cell voltage-clamped recordings of outward potassium currents (left panel) from a holding potential of –80 mV and stepped in 10 mV increments to 30 mV for 250 msec. The right panel shows activation of IH in the same neuron in response to hyperpolarizing steps of–70 to –130 mV from – 40 mV holding potential. B, The same protocolin A is applied after addition of 5 mm CsCl to the bath solution. Outward potassium currents were unchanged (left panel), whereas IH is blocked (right panel). C, Average outward potassium currents measured at the steady-state component in the absence (○) and presence (•) of CsCl (n = 11). In these experiments, sodium and calcium in the extracellular solution were replaced by N-methyl-d-glucamine.
Figure 6.
Figure 6.
The effect of cAMP analogs on the activation of A- and C-type neurons. A, Example of the current responses to hyperpolarizing voltage steps to –70, –90, –110, –130, and –140 mV from –40 mV in the presence and absence of pCPT-cAMP (100μm) in an A-type neuron. A-type neurons were distinguished on the basis of the absence of TTX-resistant sodium currents. Tail current measurements were used to obtain activation curves in the presence (+) and absence (–) of cAMP. The normalized activation curves were fitted to a Boltzmann distribution. B, V1/2 of the activation curve in A-type neurons (n = 6) was 83 ± 1.5 in control (solid line, open circle) and 81 ± 1.9 in 0.1–1.0 mm pCPT-cAMP or 8-Br-cAMP (dashed line, filled circle) with slope values of 12.8 and 13.6, respectively. Three of the six neurons were tested with both 0.1 and 1.0 mm pCPT-cAMP. C, Examples of two C-type neurons responding to voltage steps from a holding potential of –40 mV to –60, –80, –100, and –120 mV (left) and –50, –70, –90, and –110 mV (right) in the presence (light traces) and absence (dark traces) of pCPT-cAMP or 8-Br-cAMP (100μm). For the last three voltage steps, the change in current at the same voltage is indicated by arrows. The set of traces on the right were uncorrected for cesium-insensitive current. D, cAMP analogs produced a depolarizing shift in the activation curves of C-type neurons from the control value for V1/2 of –94 ± 1.8 mV (solid line, filled triangles) to –86 ± 1.7 mV (dashedline, filled circles); n= 5 neurons. The membrane potential was held at –40 mV and 850 m sec, or 1–2 sec prepulses from –50 to –120 mV (B) or –140 mV (D) was applied in 10 mV steps. The membrane potential was returned to –80 mV to examine the tail currents.
Figure 7.
Figure 7.
CsCl hyperpolarizes the resting membrane potential and increases generation of action potentials in response to a depolarizing current step. A, B, Representative changes in membrane potential during a 750 msec step depolarizing current injection of 30 (A) and 50 (B) pA in the absence (solid line; top panel) and presence (dashed line; bottom panel) of 5 mm CsCl.C, The top panel summarizes data for four neurons that responded with only one action potential in control (closed symbols) but two or more in the presence of CsCl (open symbols). Bottom, Four neurons that produced multiple action potentials in control solution (closed symbols) increased their frequency or number of potentials in CsCl (open symbols). Each symbol represents a different neuron. Similar results were obtained for a total of 15 neurons.
Figure 8.
Figure 8.
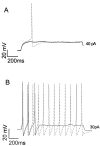
CsCl reduced the threshold for action potential generation from the same initial membrane potential. The membrane potential was returned to pre-CsCl values in the continued presence of CsCl via current injection. Two representative cells illustrating the discharge to increasing current injections in the absence (solid line) and presence (dashed line) of 1 mm CsCl are shown. A, The neuron that was quiescent in control solution discharged a single action potential in the presence of CsCl with a 40 pA current injection. B, A neuron that produced three spikes in response to a 30 pA current injection in control solution produced repetitive discharge in the presence of CsCl.
Figure 9.
Figure 9.
CsCl increased the discharge of no dose neurons during a depolarizing current ramp injection. A–C, Representative changes in membrane potential of a nodose neuron during ramp depolarizing current injections at 0.67 pA/msec (A), 1.0 pA/msec (B), and 1.33 pA/msec (C) in the absence (solid line) and presence (dashed line) of 5 mm CsCl.
Figure 10.
Figure 10.
HCN immunoreactivity in aortic baroreceptor terminals of myelinated fibers. Top, A collapsed Z-series stack of 0.4 μm confocal sections through a bush baroreceptor terminal shows localization of HCN1 (left) and PGP9.5 (right). PGP9.5 is a ubiquitin hydrolase expressed in neuronal–neuroendocrine cells. Middle, Bush ending is colabeled with HCN2 on the left and the neurofilament mixture on the right. Bottom, HCN4 immunoreactivity on the left is localized to the bush ending identified using the neurofilament mixture (right).
Figure 11.
Figure 11.
HCN immunoreactivity in club endings of myelinated fibers accompanied by fine unmyelinated fibers. Left, HCN1 (FITC) colocalized (yellow) with peripherin (Rhodamine Red-X) in a club ending but not with fine unmyelinated fiber (arrowhead). Center, HCN2 (Rhodamine Red-X) appeared in both the fine unmyelinated fibers and in a club ending of a myelinated fiber (yellow). Right, Both club endings and fine fibers (arrowhead) labeled with FITC-NF mixture also expressed HCN4 (Rhodamine Red-X). HCN2 and HCN4 (Rhodamine Red-X) are also found in cells surrounding the fibers.
Figure 12.
Figure 12.
Effect of CsCl on mechanoreceptor discharge. AC, Pressure–discharge curves of a single representative aortic baroreceptor in response to slow pressure ramp during control (A), perfused with external CsCl (B), and after washout of CsCl (C). Points represent instantaneous discharge frequency at a given pressure. The baroreceptor began to discharge at ∼90 mmHg (threshold pressure) with a frequency of ∼10 Hz (threshold frequency) in control solution. After 15 min in 5 mm Cs containing perfusate, threshold pressured ropped to 55 mmHg, and the frequency at threshold was 5 Hz. Only 200 data points are plotted in each relationship for clarity. Data analysis was based on the entire set of points (>1700 points for each relationship). D, Summary averages for threshold pressure for all aortic baroreceptors tested. Cs (5 mm) decreased the average threshold pressure for discharge. Asterisk indicates significant differences from control (p < 0.05). Points are means ± SEM. Numbers adjacent to data points indicate the number of baroreceptors tested at that concentration.

Similar articles

Cited by

References

    1. Altomare C, Bucchi A, Camatini E, Baruscotti M, Viscomi C, Moroni A, DiFrancesco D (2001) Integrated allosteric model of voltage gating of HCN channels. J Gen Physiol 117: 519–532. - PMC - PubMed
    1. Altomare C, Terragni B, Brioschi C, Milanesi R, Pagliuca C, Viscomi C, Moroni A, Baruscotti M, DiFrancesco D, Heteromeric (2003) HCN1-HCN4 channels: a comparison with native pacemaker channels from the rabbit sinoatrial node. J Physiol (Lond) 549: 347–359. - PMC - PubMed
    1. Andresen MC, Yang MY (1990) Dynamic and static conditioning pressures evoke equivalent rapid resetting in rat aortic baroreceptors. Circ Res 67: 303–311. - PubMed
    1. Andresen MC, Yang M (1992) Smooth muscle tone and rapid resetting of rat aortic baroreceptors. Circ Res 70: 116–122. - PubMed
    1. Arcangeli A, Bianchi L, Becchetti A, Faravelli L, Coronnello M, Mini E, Olivotto M, Wanke E (1995) A novel inward-rectiffying K+ current with a cell-cycle dependence governs the resting potential of mammalian neuroblastoma cells. J Physiol (Lond) 489: 455–471. - PMC - PubMed

Publication types

MeSH terms

LinkOut - more resources