. 2004 Mar 31;24(13):3413-20.
doi: 10.1523/JNEUROSCI.5429-03.2004.

Contribution of calcium ions to P2X channel responses

Affiliations

Contribution of calcium ions to P2X channel responses

Terrance M Egan et al. J Neurosci. .

Abstract

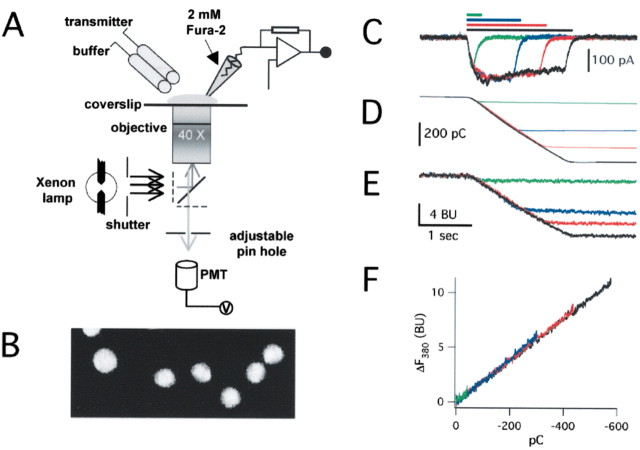
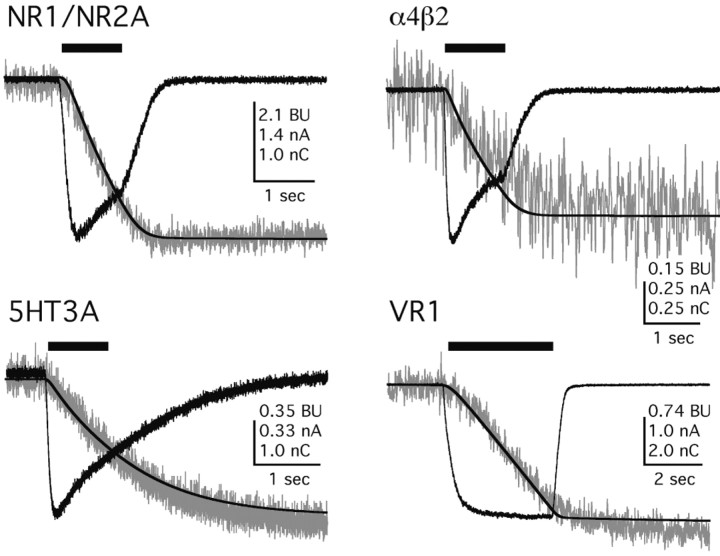
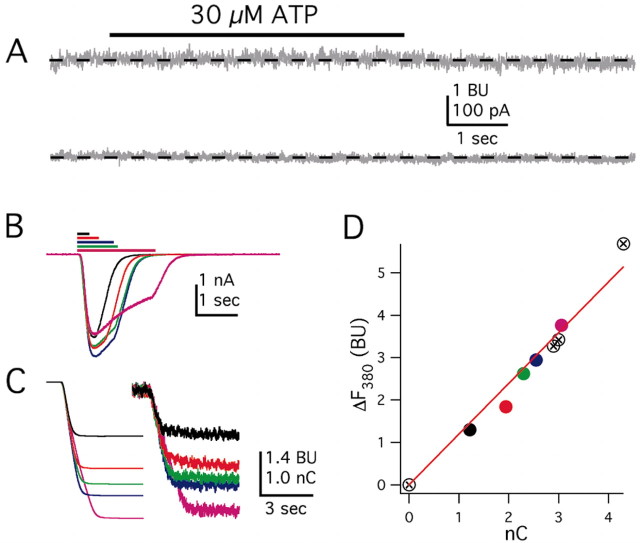
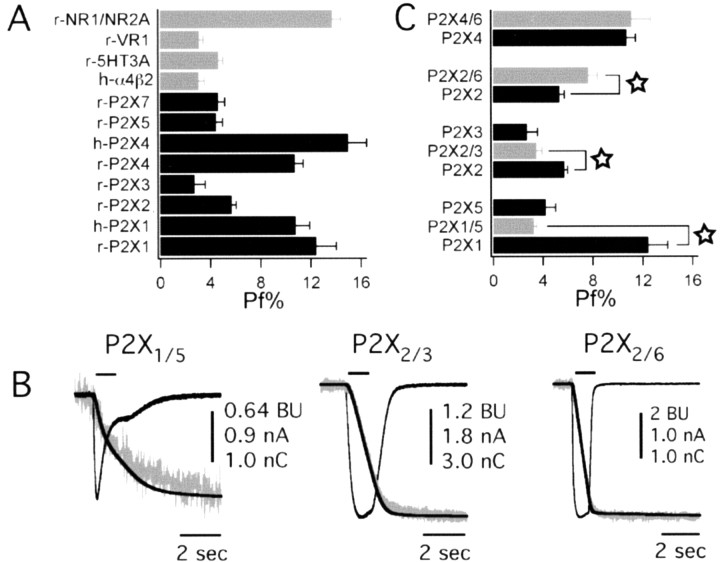
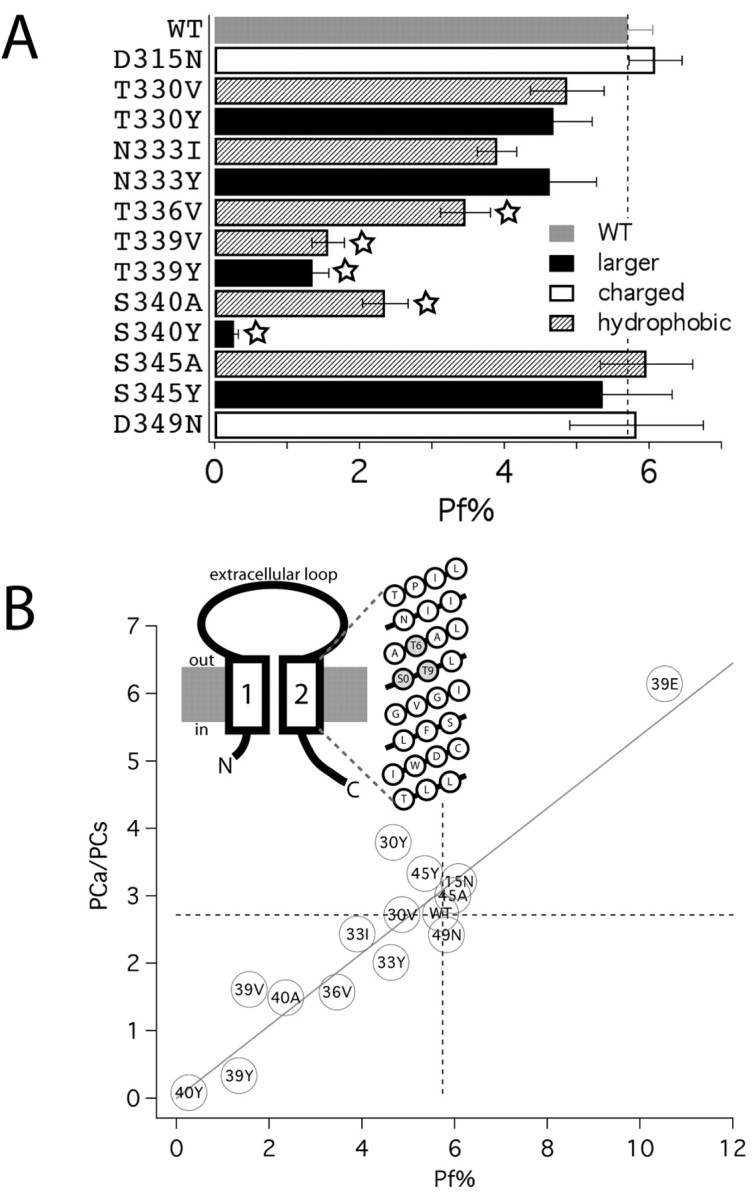
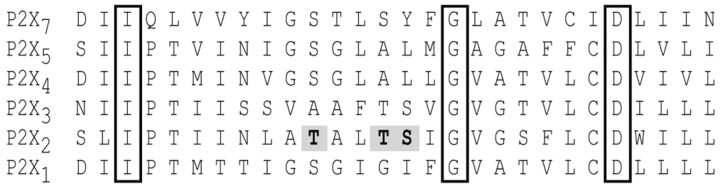
Ca2+ entry through transmitter-gated cation channels, including ATP-gated P2X channels, contributes to an array of physiological processes in excitable and non-excitable cells, but the absolute amount of Ca2+ flowing through P2X channels is unknown. Here we address the issue of precisely how much Ca2+ flows through P2X channels and report the finding that the ATP-gated P2X channel family has remarkably high Ca2+ flux compared with other channels gated by the transmitters ACh, serotonin, protons, and glutamate. Several homomeric and heteromeric P2X channels display fractional Ca2+ currents equivalent to NMDA channels, which hitherto have been thought of as the largest source of transmitter-activated Ca2+ flux. We further suggest that NMDA and P2X channels may use different mechanisms to promote Ca2+ flux across membranes. We find that mutating three critical polar amino acids decreases the Ca2+ flux of P2X2 receptors, suggesting that these residues cluster to form a novel type of Ca2+ selectivity region within the pore. Overall, our data identify P2X channels as a large source of transmitter-activated Ca2+ influx at resting membrane potentials and support the hypothesis that polar amino acids contribute to Ca2+ selection in an ATP-gated ion channel.


Figures

Figure 1.
Figure 1.
Determination of fractional Ca2+ currents. A, Representation of the experimental setup used for measuring Pf%. HEK293 cells expressing molecularly defined channels were plated onto glass coverslips and patch clamped with electrodes filled with intracellular solution containing 2 mm fura-2. ATP was applied rapidly using an automated fast solution switcher. Photons were captured through a 40× objective lens. The emitted light was filtered and directed toward a photo multiplier attached to the microscope side port, and photon counts were measured in volts. The bottom photomicrograph (B) shows images of Fluoresbrite beads that were used to calibrate the voltage signal produced by the photomultiplier tube (PMT): for illustration purposes, the images shown were captured on a confocal microscope with the iris fully open. The beads have a mean diameter of 4.6 μm. C, ATP-evoked currents of increasing duration in pure Ca2+ extracellular solutions at P2X2 channels. The holding potential was –60 mV. D shows the integral of these currents, and E shows the corresponding changes in fura-2 fluorescence at 380 nm: the time course of the change in F380 matches the time course of QT for all of the traces. F, A graph of ΔF380 and QT for each of the traces shown in C–E. They all superimpose and fall on a straight line. The slope of this line represents the proportionality constant between QT and ΔF380 bead units per picocoulomb.
Figure 2.
Figure 2.
Representative traces for QT and ΔF380 at transmitter-gated channels. For all panels in this figure, the black traces are transmitter-evoked currents (in amperes) and the integral of the current QT (in nanocoulombs), whereas the gray traces are the ΔF380 (in bead units). Appropriate agonists were applied for the times indicated by the solid bars above the traces. These agonists were as follows: 100 μm glutamate in 0 mm extracellular Mg2+ with 100 μm glycine for NR1/NR2A, 100 μm (–)-nicotine for α4β2, 10 μm serotonin for 5-HT3A, and pH 5.5 for VR1.
Figure 3.
Figure 3.
Controls and calibrations for measurements of Pf% at P2X channels. A, Lack of effect of 30 μm ATP on membrane current (bottom trace) and F380 (top trace) in a mock-transfected HEK293 cell. B–D, Representative traces for an HEK293 cell expressing P2X2 channels and activated with 10 μm ATP for increasing durations, as indicated by the length of the bars in B. B shows the current traces (for clarity, we show only 5 of the 9 traces), and C shows the corresponding integrated currents (QT, left traces) and changes in fluorescence (ΔF380, right traces). D shows a plot of ΔF380 versus QT. The data fall on a straight line, as expected if P2X channels are the only source of Ca2+. The traces and data are colored coded in B–D so that any individual response can be compared across all graphs. In D, there are four additional data points that, for the sake of simplicity, are not illustrated in B and C.
Figure 4.
Figure 4.
Representative traces for QT and ΔF380 at homomeric P2X channels. For all panels in this figure, the black traces are transmitter-evoked currents (in amperes) and the integral of the current QT (in nanocoulombs), whereas the gray traces are the ΔF380 (in bead units). Appropriate agonists were applied for the times indicated by the solid bars above the traces. These agonists were as follows: 3 μm ATP for P2X1 and P2X3; 30 μm ATP for P2X2, P2X4, and P2X5; and 100 μm benzoylbenzoyl ATP for P2X7.
Figure 5.
Figure 5.
Fractional Ca2+ currents for transmitter-gated channels. A, Mean data for Pf% of TGCCs compared with homomeric rat and human P2X channels. Note there is no data point for the P2X6 channel because no ATP-evoked responses could be measured. B, Representative raw data of three heteromeric rat P2X channels. These traces show ATP-evoked currents (black), QT (black), and ΔF380 (gray) for P2X1/5, P2X2/3, and P2X2/6 channels. An appropriate concentration of ATP (either 3 or 30 μm) for each channel was used to evoke current. C, Mean data for the measured Pf% values for ATP-evoked currents recorded from cells expressing combinations of P2X subunits. The stars indicate significant differences between the heteromeric assemblies and their homomeric counterparts.
Figure 6.
Figure 6.
Toward a molecular basis for high Ca2+ flux at P2X2 channels. A, The bar graph shows Pf% values for P2X2 mutants, as indicated with amino acids substituted for changes in side chain size, charge, and hydrophobicity. WT, Wild type. The stars indicate statistical significance. B, The diagram illustrates the presently understood membrane topology of a P2X subunit and a helical net model of the second transmembrane segment. The secondary structure of TM2 is unknown, although it is not unreasonable to assume that this segment conforms to a general pattern of helical, pore-forming domains of other ion channels (Spencer and Rees, 2002). If so, then the residues influencing Pf% at P2X2 channels cluster on one face of a predicted α helix, perhaps representing the molecular determinants of a Ca2+ selectivity filter. The graph shows the relative PCa/PCs data by Migita et al. (2001) plotted against the Pf% data shown in B. For the sake of clarity, mutants are designated by the last two digits of their position in the sequence of P2X2 and by a letter code designating the substituted amino acid. For example, T339Y is designated as 39Y. Also included are permeability and Pf% data for the mutant T339E. This mutant showed elevated Ca2+ permeability and flux, as expected after addition of fixed negative charge to a critical position within the pore (Heinemann et al., 1992).
Figure 7.
Figure 7.
Sequence alignment of the putative second transmembrane segments of P2X subunits. A stretch of 28 adjoining amino acids thought to span the membrane is shown for each of the six functional homomeric channels. The boxed amino acids are identical in all family members. Mutations of the three shaded amino acids of the P2X2 channel result in changes in Pf%.

Similar articles

Cited by

References

    1. Alonzo MT, Chamero P, Villalobos C, Garcia-Sancho J (2003) Fura-2 antagonises calcium-induced calcium release. Cell Calcium 33: 27–35. - PubMed
    1. Benham CD, Tsien RW (1987) A novel receptor-operated Ca2+-permeable channel activated by ATP in smooth muscle. Nature 328: 275–278. - PubMed
    1. Berridge MJ, Bootman MD, Roderick HL (2003) Calcium signalling: dynamics, homeostasis and remodelling. Nat Rev Mol Cell Biol 4: 517–529. - PubMed
    1. Brain KL, Jackson VM, Trout SJ, Cunnane TC (2002) Intermittent ATP release from nerve terminals elicits focal smooth muscle Ca2+ transients in mouse vas deferens. J Physiol (Lond) 541: 849–862. - PMC - PubMed
    1. Burnashev N (1998) Calcium permeability of ligand-gated channels. Cell Calcium 24: 325–332. - PubMed

Publication types

MeSH terms

LinkOut - more resources